Find out the joint distribution:
Let XI and X2 be two independent random variables each distributed uniformly in the interval [ 0, a ], where a > 0 is a constant. Find out the joint distribution of
Yl = Xl + X2 and Y2 = X1 - X2.
Instead, in vector notation, what is the distribution of Y = XA.
where
x = (X1,X2),Y= (Y1,Y2), A =  ? Find also the marginal distributions of Y1 and Y2. ?
Solution:
The joint pdf of X is
fx(x) = 1/a2, (x1,x2)? R(x)
= 0 otherwise.
Where
R(x) = {(x1,x2):0 ≤ x1 ≤ a, 0 ≤ x2 ≤ a}
The Jacobian of the transformation is
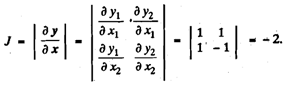
Hence the pdf of Y is
fy(y) = 1/2a2, (y1,y2)? R(y)
= 0 otherwise.
where R ( y ) is the transformed region R ( x ) under the transformation Y = XA. The range of variation of Yl is clearly [ 0,2a ] and that of Y2 is [ - a, + a ]. However Yl and Y2 are not independent.
Since the inverse transformation is
X1= ½ (Y1 + Y2), X2 = ½ (Y1 - Y2) and 0≤ x1, x2 ≤ a,
the region R ( y ) is given by
R(y) = {( Y1 + Y2) : 0 ≤ Y1 + Y2 ≤ 2a, 0≤ Y1 - Y2 ≤2a},
The Relation between R ( x ) and R ( y ) is illustrated in Figure 2.
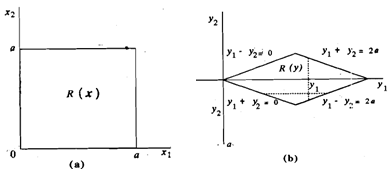
Figure: Relation between R ( x ) and R ( y ).
Note that the variables xl and x2 are independent and the region R ( x ) is such that for Xl - xl, the variation X2 does not depend on xl, but the region R ( Y ) is not of that type and the transformed variables Yl and Y2 are not independent.
The variable Yl varies in the interval [ 0, 2a]and for a fixed yl, if 0≤ y1≤ a, then y2 takes on values -y1≤y2≤ y1, while, if a< y1≤ 2a then y2 varies in the interval
-(2a-y1) <.y2 ≤ (2a - y1)
Integrating fy ( y ) with respect to y2, the marginal pdf of y2 is obtained as follows
fY1(y1) =  1/2a2 dy2 = y1/a2, for 0 ≤ y1 ≤ a
 1/2a2 dy2 = 2a-y1/a2, for a< y1 ≤ 2a
= 0 otherwise.
In a similar manner, we note that for a given Y2, if -a ≤ y2 ≤ 0 then
-y2 ≤ y1 ≤ 2a-y2, and if 0≤ y2 ≤ a then y2 ≤ y1 ≤ 2a - y2
Hence,
fY2(y2) =  1/2a2 dy1 = a+y2/a2, -a ≤ y2 ≤ 0
 1/2a2 dy1 = a-y2/a2 , 0< y2 ≤ a
= 0 otherwise.
Remarks:
The forms of pdf the marginal distributions In Example 5 are shown in Figure 3. Due to their triangular shape of pdf's, the distributions are called triangular distributions.
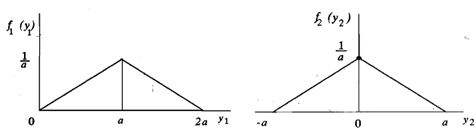
Figure: The forms of the marginal distributions of YI and Y2