Explain venn diagrams, Mathematics

Assignment Help:

Q. Explain Venn diagrams?

Ans.

Venn diagrams, named after the Englishman John Venn, are "area" or "region" diagrams that can be used to help visualize and organize different sets.

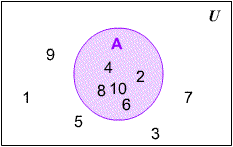
Here is an example: Let U, the universe, be the set {1, 2, 3, 4, 5, 6, 7, 8, 9, 10}. Suppose A is the subset of all even numbers contained in U. A Venn diagram can be used to visualize this:
1254_Explain Venn diagrams.gif

The shaded region shows the subset A. Notice that all of the even numbers between 1 and 10 are located inside the circle labeled A. The rectangle, labeled U, is called the universe, and you can see that all of the numbers 1, 2, 3...9, 10 are listing inside the rectangle.

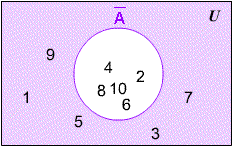
The next Venn diagram shows that the complement of A, denoted , is the set of all elements ofU, which are not in A. In set notation, we write:  702_Explain Venn diagrams1.gif

This is read "The complement of A is all x such that x is an element of U and x is not an element of A."
1545_Explain Venn diagrams2.gif

A quick note about spelling: Be careful about the way you spell the word "complement". The math term is spelled with an "e". We are not talking about compliments, which are nice things people say to each other.


Related Discussions:- Explain venn diagrams

Differance between expanded notation vs. standard notation , Differance bet...

Differance between Expanded Notation vs. Standard Notation ? A number written in expanded notation is broken down into parts just like it is in a place-value table. Example

How to convert decimals to percentages, Q. How to Convert Decimals to Perce...

Q. How to Convert Decimals to Percentages? Ans. Remember that when you have a decimal number, the digits to the right of the decimal point have the following meaning:

Develop a linear program, The production manager of Koulder Refrigerators m...

The production manager of Koulder Refrigerators must decide how many refrigerators to produce in each of the next four months to meet demand at the lowest overall cost. There is a

#tiword problem proportions, The scale of a map is 0.5 in 25mi the actua...

The scale of a map is 0.5 in 25mi the actual distance between two cities is 725mi write a proportion that represents the relationship how far apart will the cities be on the map

Evaluating a function, Evaluating a Function You evaluate a function by...

Evaluating a Function You evaluate a function by "plugging in a number". For example, to evaluate the function f(x) = 3x 2 + x -5 at x = 10, you plug in a 10 everywhere you

Exponential and geometric model, Exponential and Geometric Model Expo...

Exponential and Geometric Model Exponential model  y = ab x Take log of both sides log y = log a + log b x log y = log a + xlog b Assume log y = Y and log a

Find out the length of the parametric curve, Find out the length of the par...

Find out the length of the parametric curve illustrated by the following parametric equations. x = 3sin (t) y = 3 cos (t) 0 ≤ t ≤ 2? Solution We make out that thi

Explain the graph of an equation and graph of an inequality, Explain The Gr...

Explain The Graph of an Equation and The Graph of an Inequality ? Here is the graph of the equation y = x. Notice that for every point along the line shown in the graph, the y

Greatest common factor, x 4 - 25 There is no greatest common factor her...

x 4 - 25 There is no greatest common factor here.  Though, notice that it is the difference of two perfect squares. x 4 - 25 = ( x 2 ) 2   - (5) 2 Thus, we can employ

Write Your Message!

Captcha
Free Assignment Quote

Assured A++ Grade

Get guaranteed satisfaction & time on delivery in every assignment order you paid with us! We ensure premium quality solution document along with free turntin report!

All rights reserved! Copyrights ©2019-2020 ExpertsMind IT Educational Pvt Ltd