Explain the Systems at high pressure - Phase Diagram?
Binary phase diagrams begin to look different when the pressure is greater than the critical pressure of either of the pure components. Various types of behaviour have been observed in this region. One common type, that found in the binary system of heptane and ethane, is shown in Fig. This figure shows sections of a three-dimensional phase diagram at five temperatures. Each section is a pressure-composition phase diagram at constant T. The two-phase areas are hatched in the direction of the tie lines. At the left end of each tie line (at low zA) is a vaporus curve, and at the right end is a liquidus curve. The vapor pressure curve of pure ethane (zAD0) ends at the critical point of ethane at 305.4K; between this point and the critical point of heptane at 540.5K, there is a continuous critical curve,
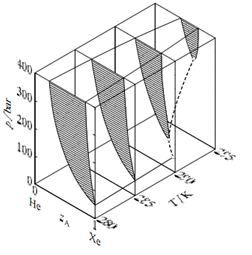
Figure: Pressure-temperature-composition behaviour in the binary xenon- helium system. The open circles are critical points; the dashed curve is the critical curve.
which is the locus of critical points at which gas and liquid mixtures become identical in composition and density. Consider what happens when the system point is at point a in Fig. and the pressure is then increased by isothermal compression along line a-b. The system point moves from the area for a gas phase into the two-phase gas-liquid area and then out into the gas-phase area again. This curious phenomenon, condensation followed by vaporization, is called retrograde condensation. Under some conditions, an isobaric increase of T can result in vaporization followed by condensation; this is retrograde vaporization. A different type of high-pressure behaviour, that found in the xenon-helium system, is shown in Fig. Here, the critical curve begins at the critical point of the less volatile component (xenon) and continues to higher temperatures and pressures than the critical temperature and pressure of either pure component. The two-phase region at pressures above this critical curve is sometimes said to represent gas-gas equilibrium, or gas-gas immiscibility, because we would not usually consider a liquid to exist beyond the critical points of the pure components. Of course, the coexisting phases in this two-phase region are not gases in the ordinary sense of being tenuous fluids, but are instead high-pressure fluids of liquid-like densities. If we want to call both phases gases, then we have to say that pure gaseous substances at high pressure do not necessarily mix spontaneously in all proportions as they do at ordinary pressures.
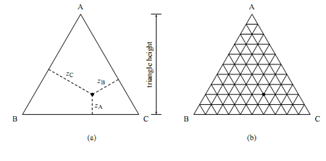
Figure: Representing the composition of a ternary system by a point in an equilateral triangle.