Explain the problem with IS-LM model, Macroeconomics

Assignment Help:

Q. Explain the problem with IS-LM model?

The starting point of AS-AD model is an assumption in IS-LM model (and in the cross model) that limits its usefulness. This is an assumption that if firms where to choose profit maximizing quantity of L (LOPT), they would produce more than aggregate demand. In IS-LM, YOPT> YD should hold.

To realize why it is a problem in IS-LM model, we gradually increase aggregate demand by increasing G. We can explain the process using figure below.

2444_Explain the problem with IS-LM model1.png

432_Explain the problem with IS-LM model.png

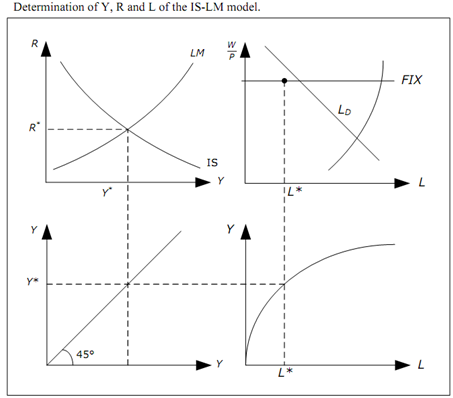
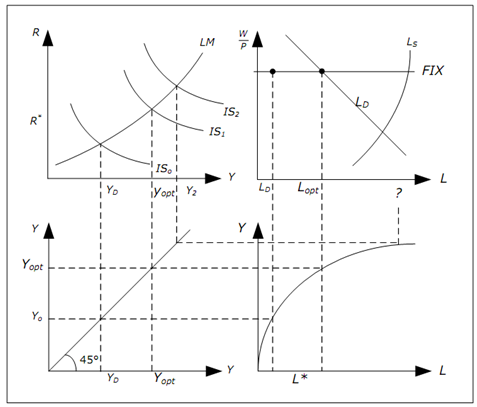
Figure: Illustrating the problem in the IS-LM model

1. Let's begin with a given real wage W/P, an IS curve (IS0) and an LM curve. In equilibrium, we would have Y = Y0 and L = L0.

2. Now increase G so that IS curve shifts outwards from IS0 to IS1. In the first step, we increase G just enough so that Y = YOPT in equilibrium It implies exactly to the level that firms want to produce at the given real wage.

3. Firms would now want to hire LOPTthat is precisely the profit-maximizing quantity of L. It is no longer essential for firms to hire less than profit maximizing quantity as there is no longer a shortage in aggregate demand. Thus far, no problems in IS-LM model. 

4. Now imagine that we increase G even more so that IS curve shifts to IS2 such that Y = Y2> YOPT. Now IS-LM model is in trouble. 

5. According to production function, to produce Y = Y2 we need L = L2. However firms will only hire LOPT if real wage is constant (that is presumed in IS-LM model). LOPT is the profit maximizing quantity - to produce more would decrease profits. 

6. As firms won't hire more than LOPT if real wages are constant, GDP can't be larger than of YOPT in the IS-LM model. This model simply can't give an answer to what will happen when we increase G in step 4 as we would be violating one of the main assumptions of IS-LM model. 

This problem isn't limited to changes in G and shifts in IS-curve. The same problem appears when we change MS and shift LM-curve. If we shift LM-curve to the right by an amount such that Y > YOPT, the IS-LM model can't be used. 

IS-LM model isn't 'wrong', but it's applicable only as long as Y > YOPT. Normally the IS-LM model will perform reasonable as long as price level is stable (low inflation) and it will do better in a recession than in a boom.


Related Discussions:- Explain the problem with IS-LM model

Estimate demand or supply-equilibrium price, Suppose that the demand curve ...

Suppose that the demand curve for apples is given by Qd = 140 -  5P, where Qd is the number of pounds demanded per year and p is the price per pound. The supply of apples can be de

Define price elasticity of demand, Suppose the price elasticity of demand f...

Suppose the price elasticity of demand for used cars is estimated to be 3 what does this mean?

Purposes economists disagree and using models of economics, Explain the pur...

Explain the purposes economists disagree and using models of economics. Using Models of Economics: a. Positive economics b. Normative economics A forecast is an easy p

Aplia Chapter Questions, Need answers for the questions (Chapters 10, 11 & ...

Need answers for the questions (Chapters 10, 11 & 12) Please see attached questions. Thanks!

Production, mention and explain four factors that determine the volume of p...

mention and explain four factors that determine the volume of production.

What is the value of the test statistic, For the United States, the mean mo...

For the United States, the mean monthly Internet bill is $32.79 per household (CNBC, January 18, 2006). A sample of 50 households in a southern state showed a sample mean of $30.63

Npv, The cash flows (CF t ) associated with an investment are listed below ...

The cash flows (CF t ) associated with an investment are listed below (assume that each cash flow occurs at the beginning of each year):                         CF 0   = -200

What are the comparative benefits, What are the comparative benefit The...

What are the comparative benefit The idea of comparative benefit defines that a nation must specialise in the industries in which it has a comparative advantage. Comparative be

Market demand curve, The entire market is capture by a single firm which ca...

The entire market is capture by a single firm which can produce at a constant average and marginal cost of AC = MC = 10. The firm faces a market demand curve given by Q = 60 ? P.

Write Your Message!

Captcha
Free Assignment Quote

Assured A++ Grade

Get guaranteed satisfaction & time on delivery in every assignment order you paid with us! We ensure premium quality solution document along with free turntin report!

All rights reserved! Copyrights ©2019-2020 ExpertsMind IT Educational Pvt Ltd