Explain the long-run phillips curve, Macroeconomics

Assignment Help:

Q. Explain the long-run Phillips curve?

The long-run Phillips curve

The augmented Phillips curve has an important consequence: the long-run Phillips curve must be vertical.

Figure: The long-term Phillips curve

2038_Explain the long-run Phillips curve.png

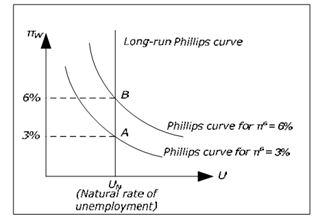
To realize this, start by drawing a Phillips curve for Πe = 3%. Only point on this curve that may apply in long run is ΠW = 3% (point A). For illustration ΠW = 2% and Πe = 3% isn't consistent with equilibrium in the long run since there is no level of inflation which is consistent with these values. p = 3% isn't possible as real wages would go to zero. p = 2% isn't possible as it would be unreasonable to continue to expect 3% inflation if inflation every year was 2%. 

According to neo-classical synthesis, we may temporarily be anywhere on lower Phillips curve when Πe = 3% however economy should ultimately return to point A (as long Πe = 3%) 

Now draw a Phillips curve for pe = 6%. Again, on this curve there is just one point is consistent with equilibrium in the long run and it is the point where ΠW = 6% (point B). This point should be exactly above A as new curve should be exactly three units above the first curve. 

If we draw all possible Phillips curves, we see that all points consistent with long run equilibrium should lie on a vertical curve and this curve is known as long-run Phillips curve. In the long run, economy should return to this curve. This means that in long run, there is no relation between unemployment andinflation. In the long term, economy returns to natural unemployment rate as in the classical model.


Related Discussions:- Explain the long-run phillips curve

Online homework, I want you to do online homework as you did before on apl...

I want you to do online homework as you did before on aplia.com All questions are 10. They are in Aggregate Demand and Aggregate Supply The deadline within 24 hours. Please do

Production possibilities curve, Using a production possibilities curve, an ...

Using a production possibilities curve, an economy that produces an output combination less than the maximum possible is depicted by a point located. a. at the top corner of the

During the 1990s, During the 1990s, technological advance reduced the cost ...

During the 1990s, technological advance reduced the cost of computer chips. Explain, with the use supply and demand diagrams, how the following markets are affected in terms of pri

Expected cost of building the boat, Half the members of a fishing tribe cat...

Half the members of a fishing tribe catch four fish per day and half catch 10 fish per day. A group of 10 members could build a boat for another tribe in one day and receive a paym

State the appropriate null and alternative hypotheses, Suppose a new produc...

Suppose a new production method will be implemented if a hypothesis test supports the conclusion that the new method reduces the mean operating cost per hour. a. State the appro

Demand for money, what is the meaning of the statement ''money is not merel...

what is the meaning of the statement ''money is not merely a veil or wrapper''?

#title., .Clearly explain how net foreign investment links the market for l...

.Clearly explain how net foreign investment links the market for loanable funds and the market for foreign currency exchange. Make sure you define net foreign investment in your an

The short-run macroeconomic equilibrium, The figure below defines an econom...

The figure below defines an economy's aggregate demand curve and its short-runand long-run aggregate supply curves (labelled AD, SRAS, and LRAS, respectively). practically,the econ

Summary of the cross model, Summary of the cross model The below list...

Summary of the cross model The below list summarizes the cross model and associates it to classical model:  Labor Market: Real wages W/P is exogenous in cross model

Standard model, Please explain each of the following terms and explain how ...

Please explain each of the following terms and explain how each is used in the standard model. 1. Iso value line's 2. Production possibilities frontier 3. Indifference curve. You w

Write Your Message!

Captcha
Free Assignment Quote

Assured A++ Grade

Get guaranteed satisfaction & time on delivery in every assignment order you paid with us! We ensure premium quality solution document along with free turntin report!

All rights reserved! Copyrights ©2019-2020 ExpertsMind IT Educational Pvt Ltd