Explain ridge regression, Applied Statistics

Assignment Help:

Using log(x1), log(x2) and log(x3) as the predictors, do pair wise scatterplots of all pairs of variables (including the response) and comment (use the pairs function). Do you think that multi collinearity might be a problem with these data?

Plot the ridge trace for a grid of 50 values for the shrinkage parameter  over the range [0; 1]. Based on this plot suggest a reasonable value for . Find the estimates of the coecients for a ridge re gression with your chosen value of  (using centred and scaled predictors).

(The following question is based on Exercise 8.5 of Myers (1990), Classical and Modern Regression with Applications (Second Edition)," Duxbury).

With centred and scaled predictor variables, the ridge regression estimator for the coecients of the predictors is where y is the vector of responses, X is the design matrix for the centred and scaled predictors, is

1709_basic linear models.png

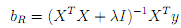
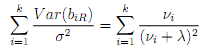
the shirnkage parameter and I denotes the identity matrix. We write n for the number of observations and k for the number of predictors. Writing biR for the ith component of bR, we will prove in this question that where 2 is the variance of the responses, and vi, i = 1,.......k are the eigenvalues of XTX. The di erent parts of the question below lead you through the proof.

735_basic linear models1.png

(a) Write XTX = QDQT for the eigenvalue decomposition of XTX, where D = diag(v1,........vk) is the diagonal matrix of eigenvalues and Q is an orthogonal matrix (QTQ = I) where the columns are the eigenvectors of XTX. Show that XTX +I = Q(D+I)QT .

2344_basic linear models2.png

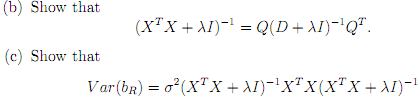
where V ar(bR) denotes the covariance matrix of bR. (Hint: recall the result from basic linear models that if Y is a k  1 random vector with V ar(Y ) = V and if A is a k  k matrix and Z = AY then V ar(Z) = AV AT ).


Related Discussions:- Explain ridge regression

Harmonic mean, Harmonic Mean  The harmonic mean  also called harmonic  ...

Harmonic Mean  The harmonic mean  also called harmonic  average, in the total numbers of items of variable divided by the sum of r reciprocals of the values of the variable. In

Mode, Mode The mode is the value which occurs most frequ...

Mode The mode is the value which occurs most frequently in a set of observations on the point of maximum frequency and around which other items of the set cluste

What are the null and alternative hypotheses, Test the following claim. Id...

Test the following claim. Identify the null hypothesis, alternative hypothesis, test statistic, critical value(s), conclusion about the null hypothesis, and final conclusion that

QUARTILE DEVIATION, Examples of grouped, simple and frequency distribution ...

Examples of grouped, simple and frequency distribution data

Find the unbiased estimators for mean and variance matrix, Is the random ve...

Is the random vector (Trunk Space, Length, Turning diameter) of US car normally distributed? Why? If yes, find the unbiased estimators for the mean and variance matrix of (Trunk Sp

Primary and secondary data, Primary and Secondary Data: Primary Data: ...

Primary and Secondary Data: Primary Data: These data are those are collected for the first time. Thus primary data are original in character and gathered   by actual observat

Correlation, Correlation The board of directors of Bata Company is face...

Correlation The board of directors of Bata Company is faced with the problem of estimating what the annual sales might be in a shop to be opened in Bagpur where Bata has not op

Multiple correspondence analysis, Correspondence Analysis (CA) is a general...

Correspondence Analysis (CA) is a generalization of PCA to contingency tables. The factors of correspondence analysis give an orthogonal decomposi:ion of the Chi- square associated

X-bar charts, First we look at these charts assuming that we know both the ...

First we look at these charts assuming that we know both the mean and the standard deviation of the process, that is  μ and  σ . These values represent the acceptable values (bench

Correlation matrix table, A.    Do the correlation matrix table. B.    W...

A.    Do the correlation matrix table. B.    Which variable (s) has the largest correlation coeffieient which is not a perfect correlation? C.    Which variable (s) has the s

Write Your Message!

Captcha
Free Assignment Quote

Assured A++ Grade

Get guaranteed satisfaction & time on delivery in every assignment order you paid with us! We ensure premium quality solution document along with free turntin report!

All rights reserved! Copyrights ©2019-2020 ExpertsMind IT Educational Pvt Ltd