Explain identifying conic sections, Mathematics

Assignment Help:

Explain Identifying Conic Sections

The graph of a quadratic equation in the variables x and y, like this one,
x2 + 3y2 + 6y = -4, is a conic sections. There are three kinds of conic section:
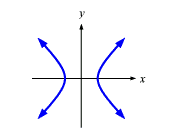
• hyperbola (a pair of bent lines)
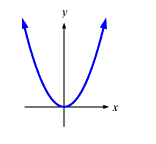
• parabola ( a single bent line)
• ellipse ( a bent circle).

You can identify these three types just by looking at the equation.
Hyperbolas have equations with both an x2 and a y2 term, and there terms have opposite signs (when written on the same side of the equation). Here are three examples:
x2 - y2 = 1
-2x2 + x + y2 = 0
x2 + y =2 + y2
And this is what the graph of a typical hyperbola looks like:


Note that if the squared terms in the third example were moved to the same side of the equation, they would have opposite signs.

2362_Hyperbolas.png

Ellipses also have equations with both an x2 and a y2 term, and these terms have the same sign. Here are three examples of ellipses:
x2 + y2 = 1
-2x2 + x - y2 = 0
x2 + y = 2 - y2
Here is the graph of the first example:

724_Ellipses.png

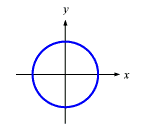
As you can see, some ellipses- the ones that aren't unevenly scaled- are just circles! Parabolas have equations with only one variable (x or y) squared, but not both.
y = x2
-2x - y2 = 0
x2 + y = 2- y
Graphs of parabolas look something like this:

Note: If the equation has an "xy" term, then you have a rotated conic section. Most calculus courses avoid this somewhat complicated issue, and deal only with non-rotated conics.

1594_Parabolas.png


Related Discussions:- Explain identifying conic sections

Difference between absolute and relative in the definition, Difference betw...

Difference between absolute and relative in the definition Now, let's talk a little bit regarding the subtle difference among the absolute & relative in the definition above.

Coefficient of determination, Coefficient of Determination It refers t...

Coefficient of Determination It refers to the ratio of the explained variation to the total variation and is utilized to measure the strength of the linear relationship. The s

How to calculate percentiles, Q. How to calculate Percentiles? Ans. ...

Q. How to calculate Percentiles? Ans. In a large group of standardized test scores we expect the scores to approximate a normal curve. If all scores are translated to z-s

Probability rules, Probability Rules A probability is a number as...

Probability Rules A probability is a number assigned to the occurrence of an event in a sample space. Probability measures must satisfy three rules. If A is an even

Iit-jee questions, can u tell me a website for iit-jee questions?

can u tell me a website for iit-jee questions?

Find the are length and sketch the level curves, 1) Find the are length of ...

1) Find the are length of r(t) = ( 1/2t^2, 1/3t^3, 1/3t^3) where t is between 1 and 3 (greater than or equal less than or equal) 2) Sketch the level curves of f(x,y) = x^2-2y^2

Solve the differential equation, Solve the subsequent differential equation...

Solve the subsequent differential equation and find out the interval of validity for the solution. Let's start things off along with a fairly simple illustration so we can notic

Absolute value, Consider x € R. Then the magnitude of x is known as it's...

Consider x € R. Then the magnitude of x is known as it's absolute value and in general, shown by |x| and is explained as Since the symbol   always shows the nonnegative

Write Your Message!

Captcha
Free Assignment Quote

Assured A++ Grade

Get guaranteed satisfaction & time on delivery in every assignment order you paid with us! We ensure premium quality solution document along with free turntin report!

All rights reserved! Copyrights ©2019-2020 ExpertsMind IT Educational Pvt Ltd