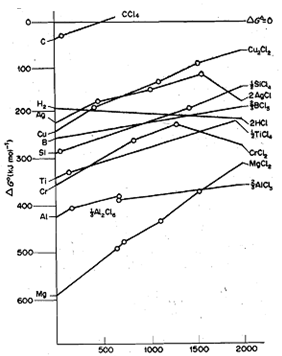
Q. Explain Ellingham Diagrams?
Ellingham studied the variation of standard free energy change for the formation of a number of compounds, e.g., oxides, sulphides and chlorides, with temperature and plotted ΔGO against temperature. Such diagrams showing the variation of ΔG0 with Tare called Ellingham diagrams after his name. As said above, ΔG0 is related to ΔH0, ΔS0 and T according o the following equation:
ΔG0 = ΔH0 - TΔS0
You also know that for most of the chemical reactions, ΔH0 and Ma do not change significantly with temperature and can be regarded as constant. Thus, ΔG0 plotted against T .gives a graph of constant slope, which is equal to -ΔS0. But, due to abrupt changes in ΔS0 breaks in the graph occur at temperatures at which reactants or products melt or boil, i.e., undergo phase change.
Fig. shows the Ellingham diagrams for the formation of metal oxides from free elements. By examining the Ellingham diagram for the formation of an oxide, we can find out the temperature at which the standard free energy change for the reaction will become positive. For example, consider theΔG0/T graph for the reaction of zinc with oxygen:
2Zn(s) + O2 (g) -------------------> 2ZnO(s)

At 273 K, the value of standard free energy change for this reaction is 400 kJ, which becomes less negative as temperature rises and eventually at 2173 K, it becomes zero. Above this temperature, ΔG0 will become more positive, therefore ZnO will spontaneously decompose to zinc and oxygen. This behaviour is typical for all elements except carbon; at sufficiently high temperatures the oxides become unstable relative to their constituent elements.
With the help of Ellingham diagrams, we can find out the standard free energy changes for a large number of reactions. For example, we can read off from the diagram the standard free energy changes for the following two reactions at 298 K:
2C(s) + O2 (g) ----------> 2CO(g) : ΔG0 = - 275 kj
2ZnO(s) ----------------> 2Zn(s) + O2(g) : ΔG0= + 640 kj
You may note that the standard free energy change in Eq. 15.2 is positive because it represents the decomposition of zinc oxide. On adding above two equations and respective ΔG0values we get,
2ZnO(s) + 2C(s) -----------> 2Zn(s) + 2CO(g): ΔG0 = + 365 kj
Because the standard free energy change for the above reaction is positive, the reaction has little tendency to occur at 298 K. Since, two moles of gaseous product, i.e., CO; are produced during the reaction,ΔS0 is positive. Therefore, ΔG0 decreases with increase in temperature and will become zero at some temperature. In this particular case, ΔG0 becomes zero at 1 173 K as can be seen from Fig. This temperature corresponds to the point of intersection of the two graphs for C/CO and Zn/ZnO systems. Above this temperature, ΔG0 will become negative. Therefore, carbon will reduce zinc oxide above 1173 K - a temperature 1000 K lower than the temperature of thermal decomposition of zinc oxide. Similarly, with the help of Ellingham diagrams for Zn/ZnO and H2/H20 systems, we can find out that H2 will reduce ZnO at a temperature, of 1400 K. Since reduction of ZnO with carbon, which is also much cheaper than hydrogen, can be carried at a lower temperature, it is clear that reduction using carbon is much more economical than reduction using hydrogen.