Explain digital signal formatting, Electrical Engineering

Assignment Help:

Q. Explain Digital Signal Formatting?

After quantization and coding the samples of the message, a suitable waveform has to be chosen to represent the bits. This waveformcan then be transmitted directly over the channel (if no carrier modulation is involved), or used for carriermodulation. Thewaveformselection process is known as formatting the digital sequence. Three kinds of waveforms are available:

1. Unipolar waveform, which assigns a pulse to code 1 and no pulse to code 0. The duration of a pulse is usually chosen to be equal to Tb, if binary digits occur each Tb seconds (the bit interval's duration).

2. Polar waveform, which consists of a pulse of duration Tb for a binary 1 and a negative pulse of the same magnitude and duration for a 0. This yields better system performance in noise than the unipolar format, because of the wider distinction between the two values.

3. Manchester waveform, which transmits a pulse of duration Tb/2 followed by an equal magnitude, but negative pulse of duration Tb/2 for each binary 1, and the negative of this two-pulse sequence for a binary 0. Even when a long string of 0s or 1s may occur in the digital sequence, the advantage of this format is that it never contains a dc component.

842_Explain Digital Signal Formatting.png

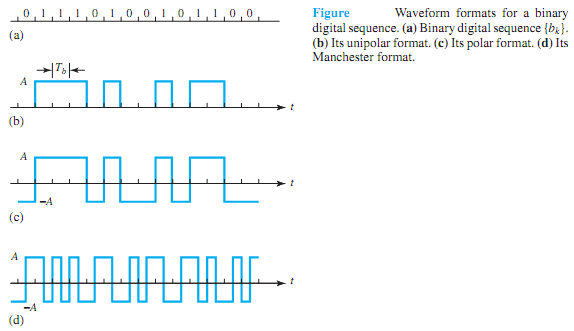
Figure illustrates these formats for a sequence of binary digits. Figure (b) shows the polar format corresponding to the coding in that case. Since it is important that a digital system not lose track of polarity while processing polar or Manchester waveforms, a technique called differential encoding is employed so as to remove the need to maintain polarity.

Because the digits in a typical digital sequence fluctuate randomly between 0s and 1s with time, the formatted waveform is then a randomly fluctuating set of pulses corresponding to the selected format.With such random waveforms, one uses the power spectral density (with units of V2 /Hz) to define the spectral content. On comparing the three waveform formats, the unipolar and polar formats both have the same bandwidth and relative side-lobe level, whereas theManchester waveform has no spectral component at direct current, but requires twice the bandwidth of the other two signals.


Related Discussions:- Explain digital signal formatting

Illustrate bcd-to-decimal decoding, Q. Illustrate BCD-to-decimal decoding w...

Q. Illustrate BCD-to-decimal decoding with a 4-to- 16 decoder, and draw the corresponding truth table.

Armature winding - motor control , Armature Winding In this  winding t...

Armature Winding In this  winding the working  emf is induced by the working  flux. The current  which is  dependent on the load  called current.  The windings  that handle

Mesh analysis, i am battling with mesh, node anaalysis, superposition, node...

i am battling with mesh, node anaalysis, superposition, node thevenin and norton equivalents

Antenna, radiation pattern optimization of a planar array antenna using BBO...

radiation pattern optimization of a planar array antenna using BBO

Charging of the capacitor, Charging of the capacitor: Considering the ...

Charging of the capacitor: Considering the below diagram, with slight approximation the ripple voltage can be supposed as triangular. To the cut-out point from the cut-in poin

Show the force exerted on each is about one million tons, Q. Consider two 1...

Q. Consider two 1-C charges separated by 1min free space. Show that the force exerted on each is about one million tons.

Digital Electronics, Design a MOD-6 synchronous counter using T Flip-Flops....

Design a MOD-6 synchronous counter using T Flip-Flops.

Draw an electrical relay diagram, Draw an electrical relay diagram rung sho...

Draw an electrical relay diagram rung showing a N/O contact of CR1(coil) in series witha N/C contact of CR2(Coil), operating a lamp L1. A delay-on (TON) relay has a preset of 5.

Flow Chart and Cause-Effect Diagram, Flow Chart and Cause-Effect Diagram ...

Flow Chart and Cause-Effect Diagram Flow Charts Flow charts are pictorial representations of a procedure. By breaking the procedure down within its constituent steps, f

Which realization requires the least number of gates, Q. Consider a 1-bit v...

Q. Consider a 1-bit version of the digital comparator shown in Figure. Note that the operation of this circuit is such that whichever output is 1 gives the desired magnitude compar

Write Your Message!

Captcha
Free Assignment Quote

Assured A++ Grade

Get guaranteed satisfaction & time on delivery in every assignment order you paid with us! We ensure premium quality solution document along with free turntin report!

All rights reserved! Copyrights ©2019-2020 ExpertsMind IT Educational Pvt Ltd