Explain about the lm curve, Macroeconomics

Assignment Help:

The LM curve 

The LM curve shows all combinations of R and Y, where the money market

is in equilibrium. The LM-curve slopes upwards.

Money market is in equilibrium when Md(Y, R) = Ms. We know how money market diagram will determine R when we know Y. In this case, question to consider is the following: What should happen to R when we change Y if we want the money market to remain in equilibrium?  

To answer this question, we try two different values for GDP Y1 = 100 and Y1 = 200. As the MDrely positively on Y, MD (Y1, R) will be smaller than MD (Y2, R). R should thus be larger when Y increases for the money market to be in equilibrium.

1264_Explain about the LM curve.png

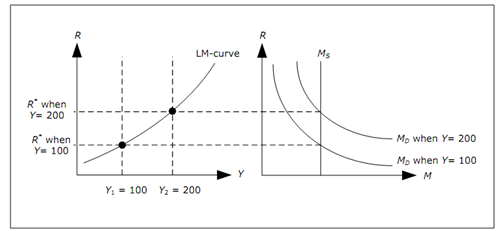
Figure: Derivation of the LM-curve

The figure above explains this point. 

1. Start by selecting Y1 and Y2 in the left graph (Y1< Y2). 

2. Draw money demand for each of the different levels of GDP in the figure to the right the one corresponding to lower value of GDP should be the smallest. 

3. Identify the resulting interest rate in the figure to the right for both levels of GDP - the larger of interest rates corresponds to larger value of GDP. 

4. Extend these interest rates to diagram on the left. It will give you two points where money market is in equilibrium. 

5. Continue with other levels of GDP. The result would be a curve in the left diagram that we call LM-curve. 

LM curve will demonstrate you all combinations of Y and R where Md(Y, R) = Ms, which is, where money market is in equilibrium. Again, economy should be on the LM curve if money market is to be in equilibrium and money market alone can't determine which point will result in equilibrium in all markets.


Related Discussions:- Explain about the lm curve

GDP and GNP, y explain whether you agree or disagree with the following sta...

y explain whether you agree or disagree with the following statements. “If nominal GDP is less than real GDP, then the price level must have fallen during the year.”

Ricardo Viner Model, How does the Ricardo Viner diagram react when once pri...

How does the Ricardo Viner diagram react when once price changes, effects on real wages, and labor allocation?

Welfare economic, Evaluate the Bergson social welfare functions

Evaluate the Bergson social welfare functions

Demand for money and gdp, Q. Demand for money and GDP? The demand for m...

Q. Demand for money and GDP? The demand for money also relies on the GDP as GDP is closely associated to national income. If you choose to hold a fixed proportion of your wealt

Correlation of investment and interest rate, Suppose the demand for loanabl...

Suppose the demand for loanable funds was stable but the supply fluctuated from year to year. what cause fluctuate in supply?

Determine what is the yield curve, Determine what is the yield curve Th...

Determine what is the yield curve The yield curve is a graph of interest rates of different maturity (recalculated to yearly rates) at a particular point in time. It is common

Find the compensating variation , Joe has preferences over pizza (p) and be...

Joe has preferences over pizza (p) and beer (b) given by U = pb. The marginal utilities are MU p = b and MU b = p, and Joe's income is I = 60. 1. Find Joe's optimal consumptio

Aggregate supply in the short run, Aggregate Supply in the Short Run P...

Aggregate Supply in the Short Run Production takes place in business sector on the basis of an expected price for its output. However, costs are incurred in anticipation of sa

Quantity equation, Quantity Equation-Has this theory worked? Why or why not...

Quantity Equation-Has this theory worked? Why or why not?

Write Your Message!

Captcha
Free Assignment Quote

Assured A++ Grade

Get guaranteed satisfaction & time on delivery in every assignment order you paid with us! We ensure premium quality solution document along with free turntin report!

All rights reserved! Copyrights ©2019-2020 ExpertsMind IT Educational Pvt Ltd