Explain about the amplitude mode of data presentation.
The A-mode:
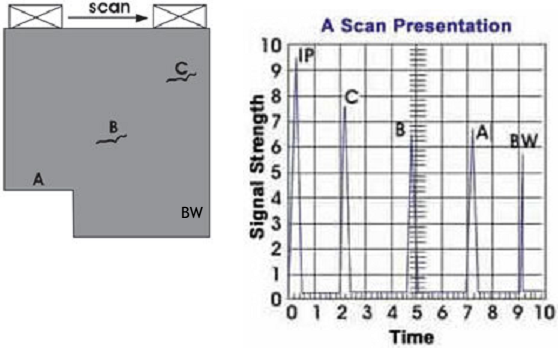
The A-mode or the Amplitude mode of data presentation exhibits the amount of obtained ultrasonic energy like a function of time. The amount of acquired energy is plotted beside the vertical axis (i.e., Y-axis) and the elapsed time (that may be associated to the sound energy travel time in the material) is displayed beside the horizontal axis (i.e., X-axis). Into the A-scan presentation, the depth from that the reflection is acquired can be found out by the position of the signal onto the horizontal sweep. Assume that look at the sample piece along with discontinuities as indicated in the demonstration of sample test piece given below at B And C. Assume that the piece have a diverse depth, A in the initial region while compared to the rest.

Figure: Sample test piece
In the demonstration of the A-scan presentation to the right, the initial pulse produced by the transducer is represented through the signal IP that is near time zero. Since the transducer is scanned along the surface of the part, other four signals are probable to appear at diverse times on the screen.
1. While the transducer is in its far left position, simply the IP signal and signal A, the sound energy reflecting by surface A, will be appeared on the trace.
2. Since the transducer is scanned to the right, a signal throguh the backwall BW will seen later in time, showing which the sound has travelled farther to reach such surface.
3. While the transducer is over flaw B, signal B will see at a point onto the time scale which is approximately halfway among the IP signal and the BW signal. As the IP signal corresponds to the front surface of the material, that indicates which flaw Bis about halfway among the front and back surfaces of the given sample.
4. While the transducer is moved over flaw C, signal C will seem earlier in time as the sound travel path is shorter and signal B will disappear as sound will no longer be reflecting from this.
When the input pulse is of sufficiently high energy and the size of discontinuity into the direction of propagation is small, in that case along with the signal from B or C, we may be capable to observe the echo through the backwall BW also.