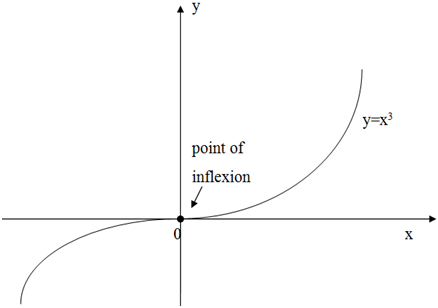
Example of inflection point
Determine the points of inflection on the curve of the function
y = x3
Solution
The only possible inflexion points will happen where
(d2y)/( dx2) = 0
From specified function as:
(dy)/(dx) = 3x2 and (d2y)/( dx2) = 6x
Equating the second derivative to zero, we include
6x = 0 or x = 0
We test whether the point at that x = 0 is an inflexion point as follows
While x is slightly less than 0, ((d2y)/(dx2)) < 0; it means a downward concavity
While x is slightly larger than 0, ((d2y)/(dx2)) > 0; it means an upward concavity
Hence we have a point of inflexion at point x = 0 since the concavity of the curve changes as we pass from the left to the right of x = 0
Illustration:-
maximize and the revenue
1. The per week revenue Sh. R of a small company is specified by
R = (14 + 81x - (x3/12)) whereas x is the number of units produced.
Required
i. Find out the number of units that maximize the revenue
ii. Find out the maximum revenue
iii. Find out the price per unit that will maximize revenue
Solution
i. To determine maximum or minimum value we needs differential calculus as given below:
R = (14 + 81x - (x3/12))
(dR)/(dx) = 81 - (1/12) . (3x2)
(d2R)/(dx2) = 0 - (1/12) . (3.2x) = -(x/2)
Put (dR)/(dx) = 0 that is 81 - (1/4)x2 = 0
That gives x = 18 or x = -18
(d2R)/(dx2) = -(x/2)
Hence when x = 18;
(d2R)/(dx2) = -9
That is (-) negative indicating a maximum value.
Hence at x = 18, the value of R is a maximum. Correspondingly at x = -18, the value of R is a minimum. Thus, the number of units that maximize the revenue = 18 units
i. The maximum revenue is given as
R = 14 + 81 + 18 - ((18)3)/12
= Shs. 986
ii.The price per unit to maximize the revenue is given as:
986/18 = 54.78 or Shs.54.78