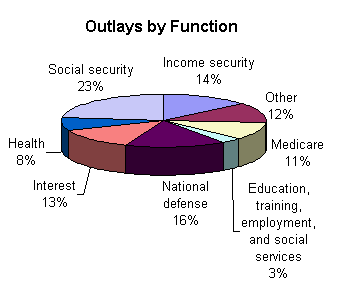
Q. Example of circle graphs?
Ans.
The United States Government pays obligations annually, called "outlays".
Medicare contributes to the health and well being of aged and disabled Americans.
Education, training, employment, and social service programs assist citizens in developing and learning skills to expand their potential opportunities and job placement possibilities.
National defense outlays supports the defense and security of the USA.
Financing and providing health care services, aiding disease prevention, and supporting research and training is contained in the Health component of the circle graph below.
Social security contributes to the incomes security of aged and disabled Americans.
Income security benefits are paid to the aged, the disabled, the unemployed and low-income families. Included are programs such as general retirement and disability, public assistance and unemployment compensation.

In fiscal 1999, the government spent $1,703 billion dollars in outlays. How much was spent for national defense?
Solution: 16% of outlays was spent on national defense.
$1,703 billion X 16% = $272 billion.
About $272 billion dollars was spent on national defense in fiscal 1999.