Evaluate the equilibrium price and quantity, Microeconomics

Assignment Help:


Evaluate the equilibrium price and quantity

(a) Find the equilibrium price and quantity

(b) If government in trying to control the price of the good fixes the price at c550

(i) Explain the type of price control the government has applied using an appropriate diagram.

(ii) Calculate and explain the type of excess which will result from the price control.

(iii) Give three (3) problems that the excess in (ii) may cause.

Answer


453_Evaluate the equilibrium price and quantity.png

(a) Given the demand function QD= -3P + 5000 and the supply function as

Qs = 2P + 2000. At equilibrium , QD = QS

-3 + 5000 = 2P + 2000

5000 - 2000 = 2P + 3P

3000 = 5P

3000/5 = P P = c600

Therefore

Q = 2(600) + 2000

Q = 1200 + 2000

Q = 3200 bags/units

The equilibrium price and quantity are c600 and 3200 units respectively.


(N) or cedi (C) for price

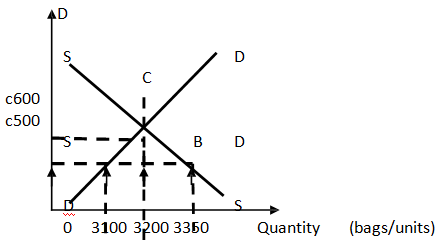
(i) If government fixes the price of the good at c550, this will be a maximum price control. This is because c550 is below the equilibrium price of c600.

(ii) At the price of c550.

QD = -3P + 5000 = -3(550) + 5000 = -1650 + 5000 = 3350 bags/units

Qs = 2(550) + 2000 =1100 + 2000 = 3100 bags/units

Excess demand = QD – Qs = 3350 – 3100 =250 bags/units

At the maximum price of c550, quantity demanded of 3350 bags/units exceeds the quantity supplied of 3100 bags/units resulting in an excess demand of 250 bags/units .


Related Discussions:- Evaluate the equilibrium price and quantity

Define solvency margin, In relation to solvency margins in the insurance in...

In relation to solvency margins in the insurance industry, the solvency margin is the amount of regulatory capital an insurance undertaking is obliged to hold against unforeseen ev

Supply and demand, During the 1990s, technological advance reduced the cost...

During the 1990s, technological advance reduced the cost of computer chips. Explain, with the use of supply and demand diagrams, how the following markets are affected in terms of

Intermediate economics, what are the variables to be included in the social...

what are the variables to be included in the social welfare of a country?

Explain the difference between a stock and a flow, Explain the difference b...

Explain the difference between a stock and a flow.   A stock is something whose quantity is calculated at a point in time, whereas a flow measures the quantity of something ove

Define the term supply, Demand is defined as a schedule of the quantities f...

Demand is defined as a schedule of the quantities fo good that will be purchased at various prices similarly the supply refers to the schedule of the quantities of a good that will

Equilibrium of a multi product firm, explain graphically Equilibrium of a ...

explain graphically Equilibrium of a multi product firm

Identify the four essential economic activities, Identify the four essentia...

Identify the four essential economic activities. The four main economic activities are: a)  resource maintenance, b)  production, c)  distribution, and d) consumpti

ECON Worksheet, Deadline is 20 Hours... 1. A. Explain how one derives the...

Deadline is 20 Hours... 1. A. Explain how one derives the indifference curves from a 3-dimensional utility function. Draw a graph and explain. Which principle explains the concav

Write Your Message!

Captcha
Free Assignment Quote

Assured A++ Grade

Get guaranteed satisfaction & time on delivery in every assignment order you paid with us! We ensure premium quality solution document along with free turntin report!

All rights reserved! Copyrights ©2019-2020 ExpertsMind IT Educational Pvt Ltd