Estimation of difference among two means, Mathematics

Assignment Help:

Estimation of difference among two means

We know that the standard error of a sample is given by the value of the standard deviation (σ) divided by the square root of the number of items in the sample (√n).

However, when given two samples, the standard errors is described by

885_Estimation of difference among two means.png

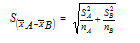
Also note that we do calculate approximately the interval not from the mean although from the difference between the two samples means that is: (x¯A - x¯B)

The appropriate number of confidence level does not change

Thus the confidence interval is described by:

 (x¯A - x¯B) ± Confidence level S(A - x¯B)

=  (x¯A - x¯B)  ± Z  S(A - x¯B)

Illustration

Given two samples A and B of 100 and 400 items respectively, they contain the means x¯1= 7 ad x¯2 = 10 and standard deviations of 2 and 3 respectively. Construct confidence interval at 70 percent confidence level?

Solution

Sample                        A                                  B

                               x¯1 =      7                      x¯2= 10

                               n1 = 100                       n2 = 400

                               S1 = 2                           S2 = 3

The standard error of the samples A and B is described by:

S(A - x¯B) = √{(4/100) + (9/400)}

= ¼ = 0.25

At 70 percent confidence level, then appropriate number is equal to 1.04 or as read from the normal tables

(x¯1 - x¯2)= 7 - 10 = - 3 = 3

We take the absolute value of the difference among the means for illustration, the value of   x¯ = absolute value of X that is a positive value of X.

Therefore Confidence interval is described by:

= 3± 1.04 (0.25 )          From the normal tables a z value of 1.04 provide a value of 0.7.

= 3± 0.26

= 3.26 and 2.974

Hence 2.974 ≤ X ≤ 3.26


Related Discussions:- Estimation of difference among two means

Vector function - three dimensional spaces, Vector Function The good wa...

Vector Function The good way to get an idea of what a vector function is and what its graph act like is to look at an instance.  Thus, consider the following vector function.

Trigonometry, Prove: 1/cos2A+sin2A/cos2A=sinA+cosA/cosA-sinA

Prove: 1/cos2A+sin2A/cos2A=sinA+cosA/cosA-sinA

Initial recognition of the financial instruments, Grimm plc (Grimm) has the...

Grimm plc (Grimm) has the following transactions: a) On 1 st January 2010, Grimm issued 400,000 convertible £1 6% debentures for £600,000.  The professional fees associated wit

What is stem-and-leaf plots, Q. What is Stem-and-Leaf Plots? Ans. ...

Q. What is Stem-and-Leaf Plots? Ans. A stem-and-leaf plot is a table that provides a quick way to arrange a set of data and view its shape, or distribution. Each data val

Skewness-measure of central tendency, Skewness - It is a concept which...

Skewness - It is a concept which is normally used in statistical decision making. This refers to the degree whether a described frequency curve is deviating away from the gene

Angles, in the quadrilateral abcd,ab is 4.3,bd is 5.1,ad is 4.8.angle bdc i...

in the quadrilateral abcd,ab is 4.3,bd is 5.1,ad is 4.8.angle bdc is 20 degrees and angle c is 80 degrees.all dimentions in metres.calculate the unknown sides and angles of the plo

Gaussian elimination, Example1 :  Solve the subsequent system of equations....

Example1 :  Solve the subsequent system of equations. -2x 1 + x 2 - x 3 = 4 x 1 + 2x 2 + 3x 3   = 13 3x 1 + x 3 = -1 Solution The initial step is to write d

Write Your Message!

Captcha
Free Assignment Quote

Assured A++ Grade

Get guaranteed satisfaction & time on delivery in every assignment order you paid with us! We ensure premium quality solution document along with free turntin report!

All rights reserved! Copyrights ©2019-2020 ExpertsMind IT Educational Pvt Ltd