Estimation error on apparent arbitrage, Applied Statistics

Assignment Help:

This question explores the effect of estimation error on apparent arbitrage opportunities in a controlled simulation setting. We simulate returns for N = 10 assets over T = 30 years. We will use the first 20 years for estimation and the selection of the hedge portfolio ("in-sample"), and the remaining 10 years as "out-of-sample" performance evaluation period. Start out with a market return RM that is normally distributed with mean μM = 0:05 and standard deviation σM = 0:15, and assume a risk-free rate Rf = 0. All assets follow the factor model Rn,t = αn + βnRM,t + εn,t, where we assume n = 1 for all n.

We will consider three sets of parameters for the return generating process.

1428_Estimation error on apparent arbitrage.png

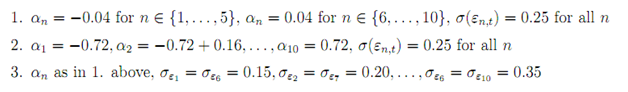
For each parameterization, perform 100 simulations (data table) for returns on market-neutral zero-investment portfolios and report the average holding period mean return and how often you investment loses money over the performance evaluation period assuming that

i) You know the parameters of the return generating process and invest equal amounts in every stock with positive alpha and short equal amounts of every stock with negative alpha

ii) You estimate the parameters and invest $1 in the stock with the highest alpha (if there is one), and short $1 of the stock with the most negative alpha (if there is one)

iii) You estimate the parameters and invest equal amounts in every stock with positive alphas (if there are) and short equal amounts of every stock with negative alphas (if there are)

iv) You estimate the parameters and come up with a more sophisticated investment strategy. Compare and explain your findings.

Notes

  • Start out with fewer simulations in your data table until you are con dent everything works
  • Your investment should hedge out all market risk (using your best estimates)
  • Take great care programming the portfolio weights in (ii)-(iv). If everything is done right, changing parameters and running the simulations should not take much time.

Related Discussions:- Estimation error on apparent arbitrage

Estimation, what do we mean by critical region

what do we mean by critical region

Measures of dispersion, calculate variance and standard deviation of the f...

calculate variance and standard deviation of the following sample 12,22,32,13,12,23,34,52,56,23,44,32,11,11

Applied, Question 1 Suppose that you have 150 observations on production (...

Question 1 Suppose that you have 150 observations on production (yt) and investment (it), and you have estimated the following ADL(3,2) model: (1 – 0.5L – 0.1L2 – 0.05L3)yt = 0.7

Perform a simple linear regression analysis, In New Jersey, banks have been...

In New Jersey, banks have been charged with withdrawing from counties having a high percentage of minorities. To substantiate this charge, data is presented in the table below conc

Muti linear regression model problem, Muti linear regression model problem ...

Muti linear regression model problem An investigator is studying the relationship between weight (in pounds) and height (in inches) using data from a sample of 126 high school

Calculate the damping ratio for each system, (i) Plot the step responses of...

(i) Plot the step responses of the following second order systems and state the nature of each system. For each case, find the poles and plot the location of the poles in the compl

Markov Chain, Each weekend, Derek either reads a book (B), goes to the cine...

Each weekend, Derek either reads a book (B), goes to the cinema (C), visits his local museum (M), or plays squash (S). If he reads a book one weekend, then he will take part in one

Types of business forecasting , Types  of business forecasting  are genera...

Types  of business forecasting  are generally as follows: 1.      Sales  and Demand  forecasts 2.      Porduction  forecasts. 3.       Cost  Forecasts 4.       Financi

Enumerate the set, Grid is the set of pairs {1, 2, 3, 4} x {1, 2, 3, 4}. ...

Grid is the set of pairs {1, 2, 3, 4} x {1, 2, 3, 4}. Image is the power set of Grid. An element of Image is a subset of Grid and can be represented by a diagram on a 4 by 4

Probability theory, Origin and Development of probability Theory: The c...

Origin and Development of probability Theory: The credit for origin and development of probability goes to the European gamblers of 17 th century. They  used to gamble  on gam

Write Your Message!

Captcha
Free Assignment Quote

Assured A++ Grade

Get guaranteed satisfaction & time on delivery in every assignment order you paid with us! We ensure premium quality solution document along with free turntin report!

All rights reserved! Copyrights ©2019-2020 ExpertsMind IT Educational Pvt Ltd