3DP, a Luxembourg-based company plans to develop and sell highly specialized 3D printers. The cost of product development is estimated at EUR 50,000.-, irrespective of whether or not the product is finally marketed. The company owners put the odds of a successful product launch at 70%.
The market for such a sophisticated piece of equipment is rather limited: the number of orders is assumed to follow a binominal distribution. In the first quarter will definitely not exceed 20, and the probability of placing a single order is evaluated at 30%. The variable cost would amount to EUR 3,300.- and the final price tag would be set at EUR 15,500.-
As the company owners have secured the patent for their innovative technology, a viable alternative to launching the production is simply to sell the license. USAin3D, a U.S.-based company is a potential buyer offering USD 7,800.- (non-negotiable) and 3DP owners must take the final decision before three months.
By that time, of course, the EUR/USD exchange rate will surely change. A friend of 3DP owners, who happens to be a financial analyst, estimates that in three months' time the EUR/USD exchange rate will fall by not more than -10.504% with the probability of 2.5%. To make this estimate, he assumed that the percentage change of the EUR/USD exchange rate follows a normal distribution with (three-month) volatility of 5.9535%. The current (spot) EUR/USD exchange rate is equal 1.3684 (dollars per one euro).
Questions:
1. Estimate the Expected Monetary Value (EMV) of the two options: product launch and selling the license. What should be the decision by the 3DP owners based solely on financial considerations? Is it a strong decision from the business point of view?
2. How would the EUR/USD exchange rate need to change in order for the 3DP owners to change their mind? What is the probability associated with such a fx movement?
Calculate the answers and present them in a short powerpoint presentation
Regression
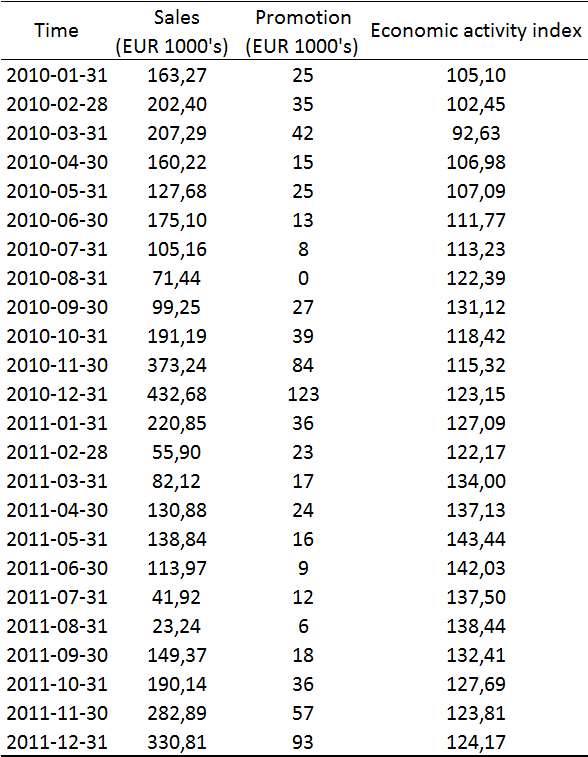
The following table presents the monthly data on the sales volume (col 2) and promotional spending (col 3) of a company. Column (4) shows an index of economic activity in the local economy.
Answer the following questions:
1. What is the correlation between:
a. sales volume and the promotional spending?
b. sales volume and the economic activity index?
c. promotional spending and the economic activity index?
Given the sizes of correlation, do you think there is a valid case for running a regression? Logically, which variable would you consider as dependent?
2. Using excel (either reglinp or Analysis ToolPak), run the regression of sales volume (dependent variable) on a constant (intercept) and promotional spending. Write down explicitly the regression equation, setting out the estimated coefficients as well as the associated standard errors.
a. What is the interpretation of the coefficients?
b. How about their signs? Do they make intuitive sense?
c. Are they statistically significant?
d. (Optional) What is the forecast sales volume assuming that the promotional spending amounts to EUR 150,000? What is the 95% confidence interval around this point forecast (hint: use formulas on p. 396 of the textbook).
3. Run another regression, this time adding index of economic activity as the second explanatory variable. What are the results now? Write down explicitly the regression equation, setting out the estimated coefficients as well as the associated standard errors.
a. Has the quality of fit improved substantially?
b. Purely from statistical (not business) perspective, is there a strong case for adding the index of economic activity as one of the explanatory variables? Why?