Estimate the area between f ( x ) =x3 - 5x2 + 6 x + 5 and the x-axis by using n = 5 subintervals & all three cases above for the heights of each of the rectangle.
Solution
Firstly, let's get the graph to ensure that the function is positive.
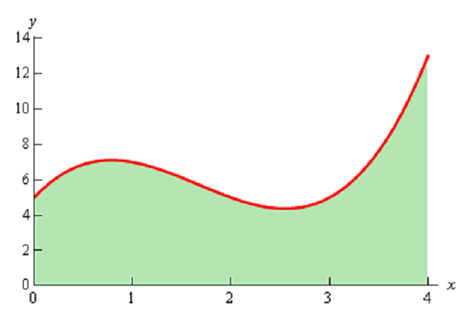
So, the graph is positive and the width of each subinterval will be,
?x = 4 /5= 0.8
It means that the endpoints of the subintervals are following,
0, 0.8, 1.6, 2.4, 3.2, 4
Let's firstly look at using the right endpoints for the function height. Following is the graph for this case.
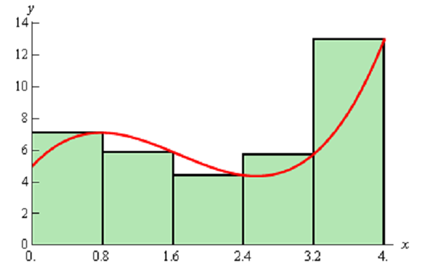
Notice as well that unlike the first area we looked at, the selecting the right endpoints here will both over & underestimate the area based on where we are on the curve. It will frequently be the case along with a more general curve that the one we at first looked at. The area estimation by using the right endpoints of each interval for the rectangle height is,
Ar =0.8 f (0.8) + 0.8 f (1.6) + 0.8 f ( 2.4)+ 0.8 f (3.2) + 0.8 f ( 4)
= 28.96
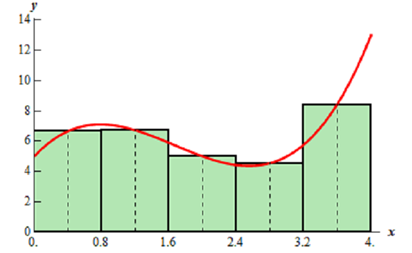
Now let's take look at left endpoints for function height. Following is the graph.
The area estimation by using the left endpoints of each of interval for the rectangle height is,
Ar = 0.8 f (0) + 0.8 f (0.8) + 0.8 f (1.6) + 0.8 f ( 2.4) + 0.8 f (3.2)
= 22.56
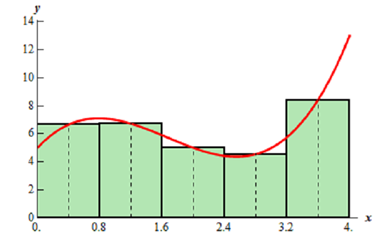
At last, let's take a look at the midpoints for the heights of each of the rectangle. Following is the graph,
The area estimation by using the midpoint is then,
Ar =0.8 f (0.4) +0.8 f (1.2) + 0.8 f ( 2) + 0.8 f ( 2.8) + 0.8 f (3.6)
= 25.12
For comparison purposes the exact area is following,
A = 76 /3= 25.333