Equilibrium and Disequilibrium
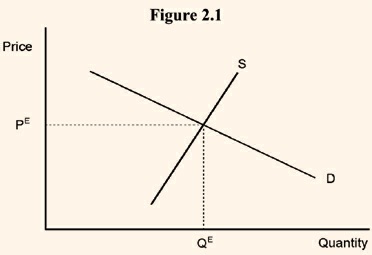
In physical sciences, equilibrium is a state of balance between opposing forces or actions. The meaning of equilibrium in economic theory is exactly the same as it is in physical sciences. Again, in both the fields, disequilibrium means the absence of equilibrium. Values of economic variables usually keep changing over time; therefore, the state of balance that defines equilibrium may perhaps be better expressed as a state of no change over time. One must bear in mind that economic equilibrium does not mean a motionless state in which no action takes place; rather, it is a state in which there is action, but the action is of a repetitive nature. Each time period exactly duplicates the preceding time period. Even though the forces acting on the system may be in a continuous state of change, the state of equilibrium is maintained as long as the net effect of these changing forces does not disturb the established position of equilibrium.To illustrate the above, consider from microeconomics the standard simple upward sloping supply curve and downward sloping demand curve for a commodity (see Figure 2.1). If PE is the equilibrium price which equates the quantity demanded and the quantity supplied, the same equilibrium quantity QE is bought and sold in every time period if the supply and demand curves are the same in each time period. The market is in balance but not motionless. Sellers keep bringing the commodity to the market and the buyers keep purchasing it. In a market where the supply and demand curves are continually shifting, the market may be in a constant state of disequilibrium. In such a situation, the market is constantly moving toward equilibrium, but the equilibrium position changes before the market gets to it. However, even for markets in continuous disequilibrium, the concept of equilibrium is a valuable analytic tool. If at any point in time an equilibrium position exists (though the market may not be at this position), this at least indicates the direction in which the system is going to move.
The ideas of stock equilibrium and flow equilibrium are very important. Before trying to understand these concepts from macroeconomics, consider the following simple example. Suppose, water is flowing through a pipe into a reservoir at the rate of 5,000 gallons per day. Water is also flowing out of the reservoir at the rate of 3,000 gallons per day. These flows would be described as equilibrium flows as long as they do not vary in size from day-to-day over the period of time considered. However, this flow equilibrium produces stock disequilibrium. If the stock of water were measured at the same point in time each day, we would find the stock of water to be growing at the rate of 2,000 gallons per day. Therefore, stock disequilibrium is logically consistent with flow equilibrium.
Now for an example from macroeconomics. Suppose that gross investment in the economy is constant at 10,000 per year and the capital consumption is constant at the rate of 2,000 per year. These two flows determine a flow equilibrium of a net addition of 8,000 units of capital stock to the economy. Since the capital stock of the economy is growing, we have stock disequilibrium. When the capital stock is increasing, we have the case of a growing economy. In contrast, an economy in which the gross investment and capital consumption are the same, the capital stock is constant, and we have the case of a stationary economy. Flow equilibrium is essentially a short run concept, stock equilibrium is a long run concept. Because flow equilibrium is necessary for stock equilibrium, short run equilibrium is, therefore, necessary for long run equilibrium. For short run equilibrium, the disequilibriating effects that flows produce on stocks are disregarded and instead the focus is only on the conditions necessary to achieve flow equilibrium. However, for long run equilibrium, the counter effects produced on flows by disequilibrium in stocks are considered, and for full equilibrium we need both flow and stock equilibrium.