Enumerate the set, Applied Statistics

Assignment Help:

Grid is the set of pairs {1, 2, 3, 4} x {1, 2, 3, 4}.

Image is the power set of Grid.

An element of Image is a subset of Grid and can be represented by a diagram on a 4 by 4 grid (as in Figure).

Let A and B be the elements of Image, whose diagrams are as shown in Figure.

2368_Enumerate the set.png


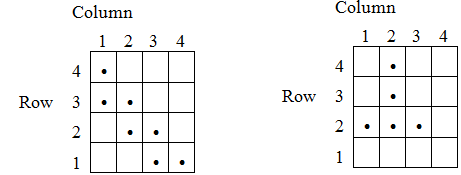
(a) The set, A can be enumerated as below. Enumerate the set B in a similar way.
A = {(1,1), (2,1), (2,2), (3,2), (3, 3), (4, 3), (4,4)}

(b) Now suppose that A and B are variables of type Set of Pair of Int,Int whose states correspond to the diagrams shown in Figure 2. Each of the following method calls will then return a value of type Set of Pair of Int,Int. Give the diagram corresponding to each of the sets of pairs in (i)-(iii)

(i) A.intersect(B)

(ii) B.minus(A)

(iii) B.union(A)

(c) A set C is defined below by comprehension.

C = {(x,y) in Grid : (x == y) ∨ (y == x + 1)}

Enumerate the set C (as a set of pairs), and give its diagram.

(c) Suppose that the code fragment below is executed. The final state of mySet will be a set of pairs forming an element of Image. Give the corresponding diagram.

var mySet in Set of Pair of Int,Int

var p in Pair of Int,Int var x in Int

var y in Int

for (x <-- 1 to 4)

{

for (y <-- 1 to 4)

{

if ((x = = 4)\/(y = = 1)) then

{ p.setPair(x,y) mySet.addElement(p)

}

}

}

The diagrams required for this question can be included in an electronic document.


Related Discussions:- Enumerate the set

Muti linear regression model problem, Muti linear regression model problem ...

Muti linear regression model problem An investigator is studying the relationship between weight (in pounds) and height (in inches) using data from a sample of 126 high school

Measures of dispersion, calculate variance and standard deviation of the f...

calculate variance and standard deviation of the following sample 12,22,32,13,12,23,34,52,56,23,44,32,11,11

Types of business forecasting , Types  of business forecasting  are genera...

Types  of business forecasting  are generally as follows: 1.      Sales  and Demand  forecasts 2.      Porduction  forecasts. 3.       Cost  Forecasts 4.       Financi

Cluster sampling, Cluster Sampling Here the population is divide...

Cluster Sampling Here the population is divided into clusters or groups and then Random Sampling is done for each cluster. Cluster Sampling differs from Stratified Sampl

Determine the matrix of the transformation, Consider the linear transformat...

Consider the linear transformation (a) Find the image of (3 , -2 , 2) under T. (b) Does the vector (5, 3) belong to the range of T? (c) Determine the matrix of the transf

Probability, HOW WOULD YOU INTERPRET THIS PROBABILITY:P(a)=1.05

HOW WOULD YOU INTERPRET THIS PROBABILITY:P(a)=1.05

Arithmetic average or mean, Arithmetic Average or Mean The arithmetic m...

Arithmetic Average or Mean The arithmetic mean is the most widely and the most generally understandable of all the averages. This is clear from the reason that when the term

Mode, Mode The mode is the value which occurs most frequ...

Mode The mode is the value which occurs most frequently in a set of observations on the point of maximum frequency and around which other items of the set cluste

Write Your Message!

Captcha
Free Assignment Quote

Assured A++ Grade

Get guaranteed satisfaction & time on delivery in every assignment order you paid with us! We ensure premium quality solution document along with free turntin report!

All rights reserved! Copyrights ©2019-2020 ExpertsMind IT Educational Pvt Ltd