ELEMENTARY THEORY OF PRICE FORMATION: DEMAND-SUPPLY ANALYSIS:
We discuss the elementary theory of price formation. Demand curve in the market is derived from the aggregate consumer demand and supply curve is derived from the aggregate firms supply. Since market demand curve for a good is the sum total of demand for that good of all individual consumers and since demand curve for a good for an individual consumer is derived from its utility maximisation, so along the demand curve consumer's optimising behaviour is always fulfilled. That means each point on the demand curve represents that consumers are willing to purchase the corresponding demand quantity with corresponding price.
We consider perfect competition prevail in the market. In short, run perfectly competitive supply curve of a commodity in the market or industry is determined from supply curve of an individual firm, where supply curve of commodity of individual firm is derived from profit maximising objective of that firm. Hence, along the market supply curve-optimising behaviour of the firm is fulfilled. That means each point on the market supply curve represents that firms are willing to supply the corresponding supply quantity with corresponding price.
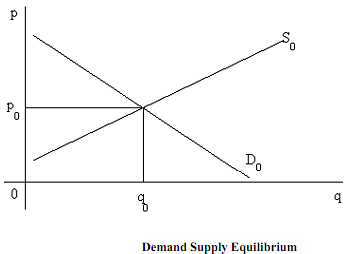
Clearly, at the point of intersection between market demand and supply curve, exchange will take place between consumers and producers, as both of them simultaneously fulfilled their optimising behaviour. Corresponding price and aggregate quantity are short run equilibrium price (say p0) and aggregate quantity (say q0) respectively, which is shown in Figure.
The process of adjustment of short run equilibrium of a competitive market takes place in the following way. Generally, by adjusting price of the commodity equilibrium in short run perfect competition is achieved as given below:
It is assumed that for any excess demand (or excess supply) prices will increase (or decrease). According to this behaviour of the market, price adjustment in disequilibrium will take place by a mechanism, which is known as auctioneer mechanism.
Suppose there is an invisible referee who controls the market price according to the above behavioural assumptions. Producers supply their quantity on the basis of existing market price. Suppose, the referee initially specifies a particular price on the basis of which producers and consumers specify their supply and demand respectively. Then suppose the referee observed that supply quantity is larger than the demand quantity i.e., we have excess supply of the commodity.