Draw logic circuit for the simplified function, Computer Engineering

Assignment Help:

Minimize the logic function Y(A, B, C, D) = ∑m(0,1,2,3,5,7,8,9,11,14). Use  Karnaugh map.
Draw logic circuit for the simplified function.

Ans: In following figure (a) shows the Karnaugh map. Because the expression has 4 variables, the map has sixteen cells. The digit one has been written into the cells containing a term in the provided expression. The decimal number has been added like subscript to specify the binary number for the concerned cell. The term ABC D can't be merged along with any other cell. Therefore this  term  will  show  as  such  in  the  last  expression. Here four groupings of 4 cell each. All correspond to the min terms (0, 1, 2, 3), (0, 1, 8, 9), (1, 3,5,7) and also (1, 3, 9, 11). All are represented in the map. Because all the terms (except 14) have been combined in groups of 4 cells, there is no requiring forming groups of two cells.
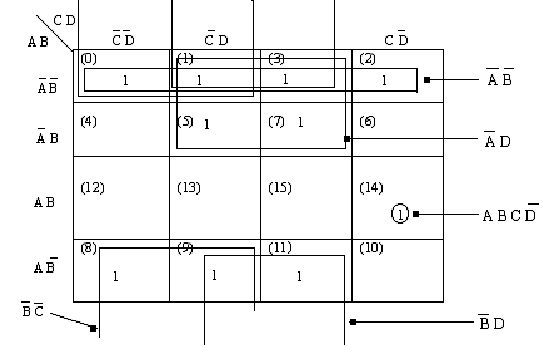
1561_Draw logic circuit for the simplified function.png

Figure (a)

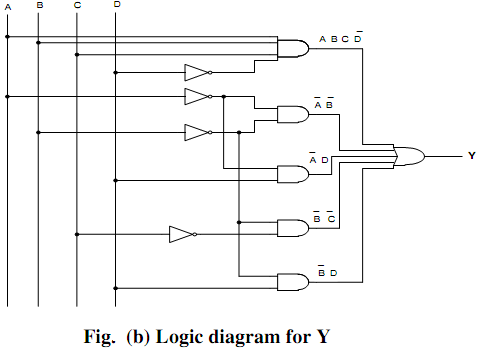
Hence simplified expression is Y (A,B,C,D) = ABC D + A B + B C + B D+ A D Fig.4 (b) shows the logic diagram for the simplified expression
Y (A,B, C, D) = ABCD‾+ A‾B‾+ B‾C‾+ B‾D‾+ A‾D

27_Draw logic circuit for the simplified function11.png


Related Discussions:- Draw logic circuit for the simplified function

Cg, raster scan display system

raster scan display system

Write the binary representation of an integer number, The integer n = 3,510...

The integer n = 3,510,593 has hexadecimal representation 0x00359141 (check this with your d2h program), while the double precision, floating-point number 3510593.0 has hexadecimal

What are the input for uml development, What are the Input for UML developm...

What are the Input for UML development UML is an attempt to standardize artefacts of analysis and design consisting of semantic models, diagrams and syntactic notations. The fi

What is fish bone diagram, What is Fish Bone Diagram? Or Explain Ishikawa D...

What is Fish Bone Diagram? Or Explain Ishikawa Diagram. Fish Bone Diagram is also known as Ishikawa Diagram or Cause and Effect Diagram. It is known as Fish Bone Diagram be

Asp.net, in asp project is i have to crate database every time when i move ...

in asp project is i have to crate database every time when i move my project on different server

Typicality of virtual addresses, The typicality of virtual addresses is tha...

The typicality of virtual addresses is that: They are longer than physical addresses because total addressed memory in virtual memory is more than actual physical memory.

What is critical section problem, What is critical section problem? A ...

What is critical section problem? A race condition at data item occurs when many processes simultaneously update its value data consistency, needs that only one process should

Important steps of the boot process, Question: Computer forensic examin...

Question: Computer forensic examiners should be concerned with at least two important settings stored in RTC/NVRAM, which is accessed by the BIOS software most often called Set

Difference between property get, Set Value is ready to ActiveX Object from ...

Set Value is ready to ActiveX Object from the form. Let Value is retried to ActiveX Object from the form. Get- Assigns the value of an expression to a variable or property.

Name a different return types of a controller action method, The following...

The following are just a few return types of a controller action process. In common an action process can return an instance of an any class that derives from Action Result class.

Write Your Message!

Captcha
Free Assignment Quote

Assured A++ Grade

Get guaranteed satisfaction & time on delivery in every assignment order you paid with us! We ensure premium quality solution document along with free turntin report!

All rights reserved! Copyrights ©2019-2020 ExpertsMind IT Educational Pvt Ltd