Distinguish demand pull-cost push , Microeconomics

Assignment Help:

Distinguish demand pull, cost push and imported inflation using graphs where appropriate. What are the likely causes of current inflation in Australia?          

Answer

Cost push inflation

1)  It occurs when there is increase in costs independent of any increase in aggregate demand.

2)  Main reason for cost push inflation are-

a)  an increase in wage rate

b)  An increase in price of raw materials

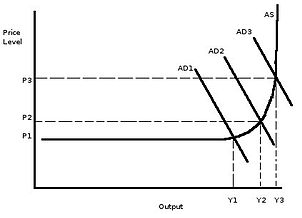
Demand Pull Inflation

1)  This represents a situation when the basic factor at work is the increase in demand for output and the pressure of demand is such that it cannot be met by the currently available supply of output.

2)  Causes of demand pull inflation are-

a)  Increase in money supply.

b)  Increase in government purchases

c)  Increased demand by firms and households.
2272_price level.png

 Imported Inflation

According to the Oxford dictionary of economics, imported inflation occurs due to increase in the prices of imports. Increases in the prices of imported final products directly affect any expenditure-based measure of inflation. Increases in the prices of imported fuels, materials, and components increase domestic costs of production, and lead to increases in the prices of domestically produced goods. Imported inflation may be set off by foreign price increases, or by depreciation of a country's exchange rate.

Likely causes of inflation in Australia are-

1)  Increased spending expenditures.

Increasing cost of food and fuel


Related Discussions:- Distinguish demand pull-cost push

Shortage, Shor tage A condition under that the quantity demanded fo...

Shor tage A condition under that the quantity demanded for a good or service exceeds the available supply for that good or service. Shortages usually cause a rise in price

Draw the 4 individual cost curves on one graph, You are the final voter in ...

You are the final voter in a brand new start-up league, the Ultra Fun Foosball League (UFFL). The directors are looking to you to make the decisions on how many teams to place in a

Supply and demand model, The vast majority of corn and soybeans produced in...

The vast majority of corn and soybeans produced in the United States is grown in the Midwestern states including: Nebraska, Iowa, Illinois, Indiana, and Ohio. This region experienc

TOTAL REVENUE AVERAGE REVENUE AND MARGINAL REVENUE, CASE STUDY IN RELATION ...

CASE STUDY IN RELATION WITH TOTAL REVENUE,AVERAGE REVENUE AND MARGINAL REVENUE

Introduction, when does market equilibrium occur?

when does market equilibrium occur?

Analyzing market product or services, Rationale of Group Project Group...

Rationale of Group Project Group project allows you to pursue authentic learning with your peers, and to apply theories taught in class and textbooks to real world situations.

Find the equilibrium price and quantity, 1. Assume that the market for whea...

1. Assume that the market for wheat is perfectly competitive. Suppose the demand curve for wheat is given by: QD = 200 – 2P where QD is the quantity demanded, in bushels, and P i

Demand and Supply , Demand and supply curve for french breads

Demand and supply curve for french breads

Central planning of economic system, Q. Central Planning of economic system...

Q. Central Planning of economic system? Central Planning: An economic system in that crucial decisions regarding consumption, investment, exchange rates, interest rates and pri

Pooling, pooling in insurance

pooling in insurance

Write Your Message!

Captcha
Free Assignment Quote

Assured A++ Grade

Get guaranteed satisfaction & time on delivery in every assignment order you paid with us! We ensure premium quality solution document along with free turntin report!

All rights reserved! Copyrights ©2019-2020 ExpertsMind IT Educational Pvt Ltd