In 2009, Research New Zealand conducted a survey on small businesses in New Zealand.
Small businesses were defined as enterprises with 19 or fewer employees. 501 small business owners, representative of New Zealand businesses with up to (and including) 19 employees were randomly selected and their answers to a number of questions were obtained. Two of the questions asked the owners about their expectations when they started the business and to what extent had these expectations been met?
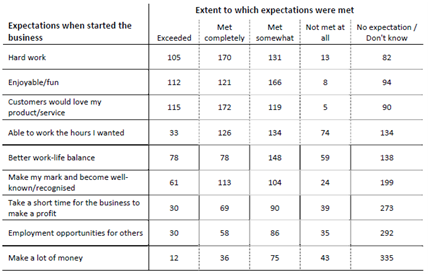
The table below details the owners' expectations and the responses to the question about the extent the expectations had been met.

(a) State the sampling situation for analysing the difference between the estimated proportion of small business owners in New Zealand whose expectation that it would be enjoyable/fun was exceeded and the estimated proportion of small business owners in New Zealand whose expectation that it would enjoyable/fun was met completely.
(b) Carry out a t-test to investigate if there is a difference between the proportion of small business owners in New Zealand whose expectation that it would be hard work was exceeded and the proportion of small business owners in New Zealand whose expectation that they would have a better work-life balance was exceeded.
Notes:
(i) Refer to the instructions on page 1 of this assignment: "Hypothesis tests in this assignment".
(ii) You must follow the step-by-step guide to performing a t-test given
(iii) At step 6 it is necessary to use either a graphics calculator, SPSS, Excel or t-tables to determine the P-value.
(iv) You can check your calculations by using the Excel spreadsheet on Cecil. Look under Assignment Resources.