Determine the closed loop speed transfer function, Applied Statistics

Assignment Help:

In the case of permanent magnet DC motor whose stator consists of a permanent magnet we can take the field current to be constant (i.e. a constant magnetic field) and it can be shown that the torque is proportional to the armature current:

246_Determine the closed loop speed transfer function.png

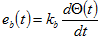
The back-emf voltage is proportional to the shaft speed:

1970_Determine the closed loop speed transfer function1.png

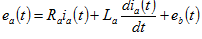
Summing the loop voltages gives:

1693_Determine the closed loop speed transfer function2.png

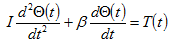
Summing the angular forces present at the motor's output shaft yields:

1722_Determine the closed loop speed transfer function3.png

The above equations can be used to create the block diagram representation of the motor. 'Blind' version of this diagram is shown below.

104_Determine the closed loop speed transfer function4.png

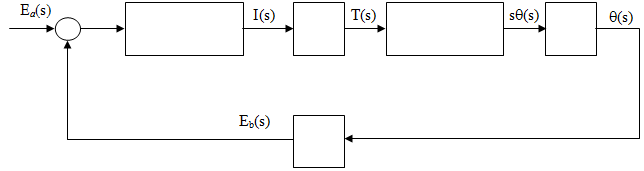
a) By taking the Laplace transform of the above equations fill in the empty blocks of diagram.

b) State the units for all constants used in the above equations.

c) What is the forward path transfer function of DC block diagram?

d) What is the feedback path transfer function of DC motor block diagram?

e) Determine the closed loop speed transfer function and state the order of the system.

f) Use Matlab/Simulink to develop a computer simulation of derived block diagram using the following data:

Ra = 0.6Ω;   La = 0.012 H;   I = 1.8kgm2;  

β = 0.6 ................;   km = 0.12 ................;   kb = 0.12 ................

          i.e. determine the motor speed step response to a step change in applied voltage from 0V to 240 V.


Related Discussions:- Determine the closed loop speed transfer function

Testing of hypothesis, Testing of Hypothesis One objective of sampling...

Testing of Hypothesis One objective of sampling theory is Hypothesis Testing. Hypothesis testing begins by making an assumption about the population parameter. Then we gather

Regression analysis , The data used is from a statistical software Minitab;...

The data used is from a statistical software Minitab; London.MPJ is the file that consists of 1519 households drawn from 1980 - 1982 British Family Expenditure Surveys. Data that i

Sample standard deviation, Sample Standard Deviation So far, we discu...

Sample Standard Deviation So far, we discussed the population standard deviation. Now, let us switch to sample standard deviation(s) that is analogous to the population stand

Standard deviation for grouped data, Grouped data  For ...

Grouped data  For grouped data, the formula applied is  σ = Where f = frequency of the variable, μ= population mea

Statistical difference, Using the raw measurement data presented below, cal...

Using the raw measurement data presented below, calculate the t value for independent groups to determine whether or not there exists a statistically significant difference between

Corelation regrassion, the two regrassion line will pass through the point ...

the two regrassion line will pass through the point (x,y)

QUARTILE DEVIATION, Examples of grouped, simple and frequency distribution ...

Examples of grouped, simple and frequency distribution data

Compute the output of correlation, Q. Compute the output of correlation? ...

Q. Compute the output of correlation? The following figure shows (a) a 3-bit image of size 5-by-5 image in the square, with x and y coordinates specified, (b) a Laplacian

Confidence interval, for this proportion, use the +-2 rule of thumb to dete...

for this proportion, use the +-2 rule of thumb to determine the 95 percent confidence interval. when asked if they are satisfied with their financial situation, .29 said "very sat

Write Your Message!

Captcha
Free Assignment Quote

Assured A++ Grade

Get guaranteed satisfaction & time on delivery in every assignment order you paid with us! We ensure premium quality solution document along with free turntin report!

All rights reserved! Copyrights ©2019-2020 ExpertsMind IT Educational Pvt Ltd