Determine partial derivatives of the demand function, Econometrics

Assignment Help:

Problem 1. Consider the demand function Q(p1, p2, y) = p1-2 p2y3, where Q is the demand for good 1, p1 is the price of good 1, p2 is the price of good 2 and y is the income. Suppose the current prices and income are (p1, p2, y) = (1, 2, 1).

(a) Find the current demand for good 1.

(b) Find the formulas for the partial derivatives of the demand function with respect to p1, p2, y.

(c) Evaluate the partial derivatives found in (b) at the current prices and income.

(d) Use the di?erentials to approximate the change in the demand as p1 increases by 0.1, p2 decreases by 0.2 and y stays the same.

Problem 2. Estimate 421_Determine partial derivatives of the demand function.png  
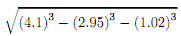
using differentials.

Problem 3. Consider the production function Q(x, y) = x2 + y2 + xy, where Q is the output, x is the quantity of input 1, y is the quantity of input 2. Suppose the current quantities of inputs are (x, y) = (5, 2).

(a) Find the current output.

(b) Find the formulas for the partial derivatives of the production with respect to x and y.

(c) Evaluate the partial derivatives found in (b) at the current quantities of inputs.

(d) Assume the ?rm is planning to retire one unit of input 1. Use the Implicit Function Theorem to estimate the corresponding change in quantity of input 2 that would keep the output at its current level.

Problem 4. One solution of the system x3y - z = 1, x + y2 + z3 = 6 is (x, y, z) = (1, 2, 1). Estimate corresponding x and y when z = 1.1.


Related Discussions:- Determine partial derivatives of the demand function

Find the best choice, Paul's utility function is u(x, y) = xy 2 . Let unit ...

Paul's utility function is u(x, y) = xy 2 . Let unit prices be given by  Px = 6 cents,  Py = 2 cents, and assume that Paul's budget is the same as Peter's from the previous problem

Econometric model, Provide a clear statement of the research topic and the ...

Provide a clear statement of the research topic and the underlying relationship that you are modeling. Identify the dependent variable and the independent variables (minimum of 3 i

Explain the inflation rate, The following regression was estimated to expla...

The following regression was estimated to explain the inflation rate in the USA.  The data set contains annual observations from 1970 to 2010.       Inft  =  2500 +   50*Xt  +

Assignment., why do we make use of regression analysis in our econometrics ...

why do we make use of regression analysis in our econometrics analysis

Stata, Replicate the estimations in Table 2 on page 82 of Graddy (1995), bu...

Replicate the estimations in Table 2 on page 82 of Graddy (1995), but excluding the data of King Whiting.

Determine the interest rate, Assume that Jane spends her entire income of $...

Assume that Jane spends her entire income of $100 on two goods,  x  and  y.  Moreover, these goods are perfect complements for her.  Let the price of good  x  go up while the price

Structural break on GARCH model, I need help on using eviews for Iterated c...

I need help on using eviews for Iterated cumulative sums of squares (ICSS) algorithm for detecing structural break. How much would it be?

Time series analysis, usefulness of time series in a business with a detail...

usefulness of time series in a business with a detailed explanation

Nonlinear Adjustment for the Integration between Internation, Hi, I''m a Ph...

Hi, I''m a PhD student in empirical finance I’m trying to conduct bivariate nonlinear conintegration tests using threshold Vector Error Correction (TVEC) methodology (Hansen and Se

Write Your Message!

Captcha
Free Assignment Quote

Assured A++ Grade

Get guaranteed satisfaction & time on delivery in every assignment order you paid with us! We ensure premium quality solution document along with free turntin report!

All rights reserved! Copyrights ©2019-2020 ExpertsMind IT Educational Pvt Ltd