Determination of all endogenous variables, Macroeconomics

Assignment Help:

Determination of all endogenous variables 

We can explain how all the endogenous variables are determined in below figure: 

Figure: The Keynesian model with the Phillips curve

1134_Determination of all endogenous variables.png

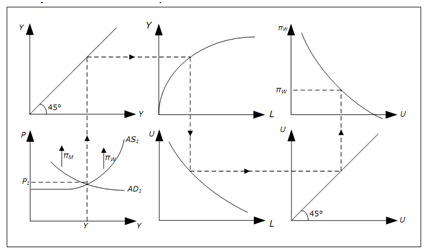
1. Start at bottom left. In year 1, AD1 and AS1 apply, price level is P1 and GDP is Y. 

2. Extend this level of GDP up to top left diagram and through 45-degree line to the production function at the top in middle.

3. In this figure we can determine how much L we need to produce Y. Extend this amount of labor down to lower middle graph and through 45-degree line to bottom right graph. 

4. This figure demonstrates relationship between L and U. The higher the unemployment rate U, the lower the amount of labor L and curve slopes downwards. From L we can conclude U which we extend up to Phillips curve in the right top graph. 

5. From the Phillips curve, we can figure out wage inflation ΠW

6. Going back to the AS-AD figure, we now the rate at which AS curve slides up or down.

AD curve slides at a rate determined by ΠMthat is exogenous. 

A significant case is when the growth in money supply is equal to wage inflation. In this case, Y is fixed and Π = Πw = ΠM. If, though, ΠM exceeds the wage inflation, AD curve will glide upwards at a faster rate than AS curve. Now Y will increase and if you follow the effect through all the 6 diagrams, you see that L will increase, U will decrease and ΠW will increase. Y will continue to increase as long as ΠW < ΠMthat means W will continue to increase until ΠW = ΠM

In Keynesian model with the Phillips curve, p and ΠW will ultimately be equal to ΠM.  As wages are presumed sticky in this model, it may take a long time for ΠW to become equal to ΠM.


Related Discussions:- Determination of all endogenous variables

Investment., whwt is the difference between the fixed accelerator and the f...

whwt is the difference between the fixed accelerator and the flexible accelerator theories of investment?

Labor force participation rate, The following Table B presents the 2010 pop...

The following Table B presents the 2010 population, employment, and unemployment data among working age persons for several countries. a. Calculate the number of people in the l

Question, The greater the number of different goods available in an economy...

The greater the number of different goods available in an economy, Question 1 options: a) the less likely it is that a double coincidence of wants will exist, and the less likel

What do you understand production method, Question 1 Discuss the relation...

Question 1 Discuss the relationship between microeconomics and macroeconomics Question 2 What do you understand production method? What precaution should be taken while

Determine the optimum prices and outputs-probability, Given the following: ...

Given the following: Airbus Boeing Demand P = 182.868 - 0.0003Q P = 198.6592 - 0.00013Q TVC Curve TVC = 104.8822Q - 0.001Q^2 + 0.09Q^3 TVC = 25.8678Q - 0.00023Q^2 + 0.4Q^3 In

Market supply of labour, Use a graphical illustration to describe briefly w...

Use a graphical illustration to describe briefly what the influence of each of the following would be on the market supply of labor:(a) an increase in immigration (b) more women en

Change in demand for the product, The price will change in the market, only...

The price will change in the market, only due to the change in demand for the product. True or false

Michaels indifference curve and dwights indifference curve, Suppose that Mi...

Suppose that Michael and Dwight each have a $60 weekly entertainment budget. They pay the same prices for two goods, "an evening reading books" (an ERB) and "an evening of beer and

Determine the probability and power curve, Learning Objective: Reinforce u...

Learning Objective: Reinforce understanding of Power, β , and α . Problem: A packing process is designed to fill steel drums with 400 pounds of a chemical. To determine whe

Circular flow – circulation of goods, Figure below demonstrates a more deve...

Figure below demonstrates a more developed version of the circular flow. In this figure we see how goods flow through various sectors of the economy. Figure Money in the c

Write Your Message!

Captcha
Free Assignment Quote

Assured A++ Grade

Get guaranteed satisfaction & time on delivery in every assignment order you paid with us! We ensure premium quality solution document along with free turntin report!

All rights reserved! Copyrights ©2019-2020 ExpertsMind IT Educational Pvt Ltd