Derive a regression forecasting equation:
The general manager of a company producing road rollers is convinced that the demand for road rollers is associated to the number of road construction tenders issued in the state during the previous years. The past data gathered is shown in the Table.
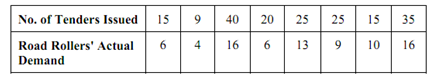
1. Derive a regression forecasting equation.
2. Estimate the demand for road roller when the number of tenders issued is 28.
3. Calculate the standard deviation of regression and the correlation coefficient.
Solution
(a) First of all, it is useful to prepare the following Table.
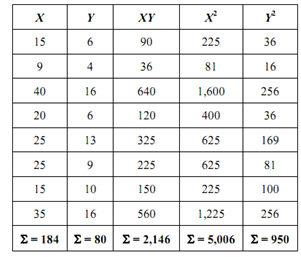
n = no. of observations = 8
x = 184 /8 = 23 ; Y = 80/8 = 10
b = 2146 - 8 (23) (10) / (5006 - 8 (23) (23)) = 0.35
and a = 10 - 0.395 (23) = 0.91
∴ Y = 0.91 + 0.395 X is the regression forecasting equation.
(b) For X = 28
Y = 0.91 + 0.395 (28) ≅ 12 road rollers
(c) Standard deviation
[ (∑Y 2 - a ∑Y - b ∑ X Y)/(n-2)] = [950 - (0.9) (80) - (0.395) (2146))/(8-2)](1/2)
= 2.2 road rollers
Correlation coefficient
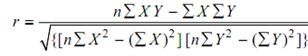
= 8 (2146) - (184) (80) /{[8 (5006) - (184)2 ] [8 (950) - (80)2 ]}1/ 2
= 0.90
The value of r is quite close to 1 indicating a very good correlation.