A company is considering whether to enter a very competitive market. In case company decided to enter in market this must either install a new forging process or pay overtime wages to the complete workers. Also in case, the market entry can result in
i. medium sales
ii. no sales
iii. low sales
iv. high sales
a) Construct a suitable tree diagram
b) Assume the management of company has estimated that if they enter the market there is a 60 percent chance of their stakeholders approving the installation of the new forge. This means that there is a 40 percent chance of using overtime a random sample of the current market structure reveals that company has a 40 percent chance of achieving high sales, a 30 percent chance of achieving medium sales, a 20 percent chance of achieving low sales and a 10 percent chance of achieving no sales. Construct the suitable probability tree diagram and find out the joint probabilities for various branches
c) Market analysts of company have shown that a high level of sales will yield shs 1,000,000 profit; a medium level of sales will result in a shs 600000 profit a low level of sales will result in a shs 200000 profit and a no sales level will reasons company a loss of shs 500000 apart from the cost of any equipment. So entering the
Market will require a cash outlay of either shs 300000 to purchase and install a forge or shs 10000 for overtime expenses should the second option be selected.
Sketch the suitable decision tree diagram
Solution
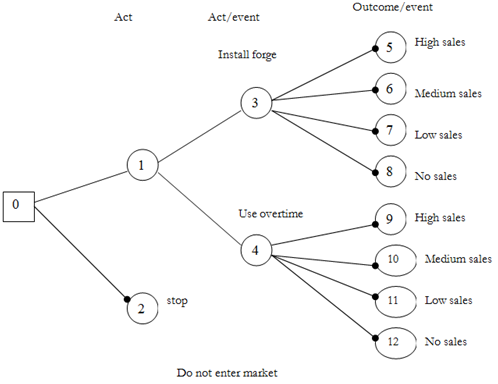
a) The tree diagram for this problem is demonstrated as given
The 1st stage of drawing a tree diagram is to show all decision points and outcome points done from left to right, concentrate first on the logic of the problem and on probabilities or values included. This is called forward pass.
The resultant is the figure below:
Tree Diagram
The entire sample space of act event choices is available to company are summarized in the table displayed below:
|
Path
|
Summary of alternative Act event sequence
|
|
0 - 1 - 3 - 5
|
Enter market, install forge, high sales
|
|
0 - 1 - 3 - 6
|
Enter market, install forge, medium sales
|
|
0 - 1 - 3 - 7
|
Enter market, install forge, low sales
|
|
0 - 1 - 3 - 8
|
Enter market, install forge, no sales
|
|
0 - 1 - 4 - 9
|
Enter market, use overtime, high sales
|
|
0 - 1 - 4 -10
|
Enter market, use overtime, medium sales
|
|
0 - 1 - 4 - 11
|
Enter market, use overtime, low sales
|
|
0 - 1 - 4 - 12
|
Enter market, use overtime, no sales
|
|
0 - 2
|
Do not enter the market
|
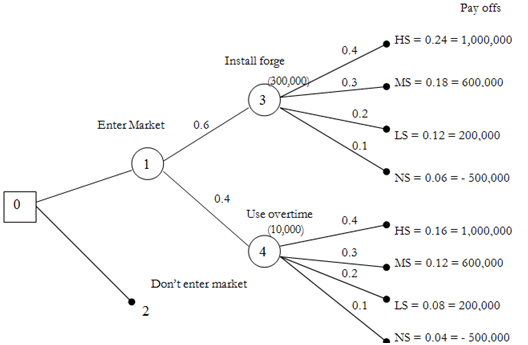
a) The appropriate probability tree is displayed in figure below. The alternatives available to the management of company are identified. The joint probabilities are result of the path sequence such is followed. For illustration, the sequence 'enter market install forge, low sales' yields (0.6) * (0.2) = 0.12 = probability to install forge and obtain low sales.
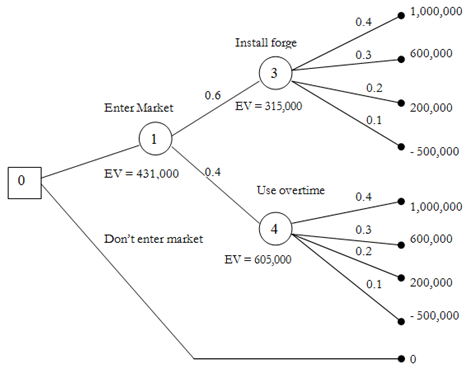
(c) The overall decision is found after analysis of the expected values at various points so correct decision along with the highest expected value is made. The stage is worked from right to left and is identified as the backward pass.
- The expected value for a decision is the highest pay off value whereas the E.V for an outcome is the summation of probability x pay off value of every branch. In both cases any expenditure incurred because of the selection of the said option is deducted.
- In our case
Node 3 = [(0.4 * 1,000,000) + (0.3 * 600,000) + (0.2 * 200,000) + (0.1 * (-50,000))] - 300,000
E.V. = 615,000 - 300,000 = 315,000
Node 4 = [(0.4 * 1,000,000) + (0.3 * 600,000) + (0.2 * 200,000) + (0.1 * (-50,000))] - 10,000
E.V. = 615,000 - 10,000 = 605,000
Node 1 = (0.6 × 315,000) + (0.4 × 605,000)
E.V. = 431,000
Node 0 = the highest of (0; 431,000)
As not entering the market has a 0 expected value
= 431,000 = thus the decision must be to enter the market.
It is represented as given below in a tree diagram.