Decision Trees And Bayes Theory
This makes an application of Bayes' Theorem to resolve typical decision problems. It is examined a lot so it is significant to clearly understand it.
Example:
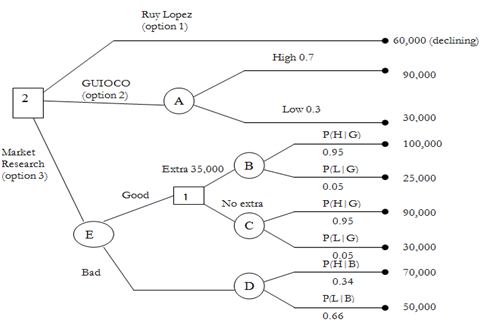
A company producing Ruy Lopez brand of cars, it is contemplating launching a new model, the Guioco. There are various possibilities that could be opted for.
- Continue producing Ruy Lopez such has profits declining at 10 percent per annum on a compounding basis. Previous year its profit was Shs. 60,000.
- Launch Guioco with no any prior market research. If sales are high yearly profit is put at Shs. 90,000 along with a probability which from past data is put at 0.7. Low sales have 0.3 probability and estimated profit of Shs. 30,000.
- Launch Guioco along with prior market research costing Shs. 30,000 the market research will show whether future sales are likely to be 'bad' or 'good'. If the research shows 'good' so the management will spend Shs. 35,000 more on capital equipment and it will raise yearly profits to Shs. 100,000 if sales are actually high. If however sales are really low, yearly profits will drop to Shs. 25,000. Should market research show 'good' and management not spend more on promotion the profit levels will be as for 2nd scenario above?
- If the research show 'bad' then the management will scale down their expectations to provide annual profit of Shs. 50,000 when sales are actually low, but due to capacity constraints if sales are high profit will be of Shs. 70,000.
Past history of the market research company had shown the given results.
|
|
Actual sales
|
|
High
|
Low
|
|
Predicted sales level
|
Good
|
0.8*
|
0.1
|
|
Bad
|
0.2
|
0.9
|
Required:
Employ a time horizon of 6 years to show to the management of the company which option theory must adopt as avoided the time value of money.
Solution
(a) First sketch the decision tree diagram
Calculations; note how probability diagram are arrived at.
- The decision tree dictates that the given probabilities require to be calculated.
For market research:
For sales outcome:
a) P(H|G)
b) P(L|G)
c) P(H|B)
d) P(L|B)
Given:
a) P(G|H) = 0.8
b) P(B|H) = 0.2
c) P(G|L) = 0.1
d) P(B|L) = 0.9
e) P(H) = 0.7
f) P(L) = 0.3
|
Good
|
P(G&H) = P(H) × P(G|H)
0.7 × 0.8 = 0.56
|
P(G&L) = P(L) × P(G|L)
0.3 × 0.1 = 0.03
|
|
Bad
|
B&H = P(H) × P(B|H)
0.7 × 0.2 = 0.14
|
P(B&L) = P(L) × P(B|L)
0.3 × 0.9 = 0.27
|
|
|
High 0.7
|
Low 0.3
|
So P(G) = P(G and H) + P(G and L)
= 0.56 + 0.03 = 0.59
And P(B) = P(B and H) + P(B and L)
= 0.14 + 0.27 = 0.41
Note that P(G) + P(B) = 0.59 + 0.41 = 1.00
From Bayes' rule as:
- P(H|G) = (P(G|H) * P(H))/ P(G)
= 0.56/0.59
= 0.95
- P(L|G) = (P(G|L) * P(L))/P(G)
= 0.03/0.59
= 0.05
- P(H|B) = (P(B|H) *P(H))/P(B)
= 0.14/0.41
= 0.34
- P(L|B) = (P(B|L) * P(L))/P(B)
= 0.27/0.41
= 0.66
Estimating financial outcome:
Option 1:
Previous year Shs. 60,000 profits
|
Year
|
|
Shs.
|
|
1 =
|
60,000 × 0.9 =
|
54,000.0
|
|
2 =
|
60,000 × 0.92 =
|
48,000.0
|
|
3 =
|
60,000 × 0.93 =
|
43,740.0
|
|
4 =
|
60,000 × 0.94 =
|
39,366.0
|
|
5 =
|
60,000 × 0.95 =
|
35,429.5
|
|
6 =
|
60,000 × 0.96 =
|
31,886.5
|
|
|
|
253,022.0
|
Option 2
Expected value of Giuoco
Node (A): 0.7(90,000 × 6) + 0.3(30,000 × 6)
= 378,000 + 54,000
= Shs. 432,000
Note that the diagram multiplied by 6 to account for the 6 years.
Option 3
Probable value of market research
Node that (B): 0.95(100,000 × 6) + 0.05(25,000 × 6)
= 570,000 + 7,500 = Shs. 577,500
Deduct Shs. 35,000 for extensions
= 542,500.
Node (C): 0.95(90,000 × 6) + 0.05(30,000 × 6)
= 513,000 + 9,000
= Shs. 522,000
Node 1: Compare B and C
B is higher, hence = 542,000.
Node (D): 0.34(70,000 × 6) + 0.66(50,000 × 6)
= 142,800 + 198,000
= Shs. 340,800
Node 2: Shs. 340,800 or else 0 - no launch
Node (E): 0.59 × 542,500 + 0.41 × 340,800
= 320,075 + 139,728 = Shs. 459,803
Less market research expenditure
459,803 - 30,000 = Shs. 429,803
Node 2: last decision summary
Option 1 EMV = 253,022
Option 2 EMV = 432,000
Option 3 EMV = 429,803
Hence we chose option 2 because it has the highest EMV.