DECISION TREE ANALYSIS
The Finance Manager of ‘Softy’ baby soap manufacturing company being successful in the first two years of the company’s operations is considering to set up another plant to meet the growing demand for the product.
If the demand is very high the new project is expected to earn Rs.5 million per annum and if the demand is low it is expected to earn Rs.2 million per annum. The probability that the demand is very high is 0.55.
The firm can set up either a large plant costing Rs.10 millions or a small plant costing Rs.5 million. Either plant will take one year to build and as such no profits are earned in year 1. Both the plants have an estimated life of 4 years after which their value is considered to be negligible.
In case of high demand, the firm can expand the small plant in year 2 at an additional cost of Rs.6 million. Alternatively, in case of low demand, the firm can reduce the large plant in year 2 and recover Rs.3 million. Expansion or reduction of plant size will take a whole year, so that in such cases no profits will be earned in year 2.
The Finance Manager can depict the entire decision process in a graphic model called ‘decision tree’.
Decision tree is considered as a mathematical model of the decision situation. All decision trees contain decision points or nodes and state of nature points or nodes. The symbols which represent these are:
 A decision node from which one of several alternatives may be chosen
 A state of nature node out of which one state of nature will occur.
The Finance Manager of ‘softy’ baby soap manufacturing company can put the information given in the form of a decision tree as shown below.
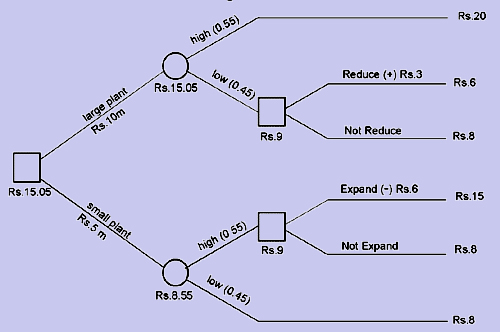
The problem represented by a decision tree is solved from right to left. At every decision node the decision maker chooses that alternative which gives him the highest income. The value at the state of nature node is obtained by adding the product of the incomes of the various states of nature and their respective probabilities.
In the given case, if a large plant is set up and in case of low demand if the plant is reduced, the income from the project would be Rs.9 million [i.e. 2 x 3 + 3] and in case its size is not reduced, income would be only Rs.8 million. Hence, if a large plant is set up and its size is reduced, the expected value would be Rs.15.05 million. If a small plant is set up and in the case of high demand if the plant is expanded, the income would be Rs.9 million and not expanded Rs.8 million. Thus, if a small plant is set up and its size is expanded the total expected value from the project would be Rs.8.55 million. It is clear from the above that the firm should decide to set up a large plant and in case of low demand reduce its size.
Remark
Decision tree analysis guides a manager to arrive at a decision in an orderly fashion. It requires the decision maker to examine all possible outcomes, desirable and undesirable, their chance of occurring, etc.