Data manipulation, Microeconomics

Assignment Help:

Data were taken with a Data Acquisition System (DAQ) and stored in the data file 'data.txt'. 'data.txt' is a text file with 3 columns containing the following data:

Column 1: Time [s]
Column 2: Voltage [V]
Column 3: Laser Doppler Vibrometer (LDV) velocity signal [mm/s]

Load the data into Matlab (use the 'load' command), and create one figure with (2x2) subplots. Plot the following data:

1.  In the 1st subplot (upper left corner), plot channel 2 in mV versus time in ms

2.  In the 2nd subplot (upper right corner), we want to plot the moving average of the voltage signal (channel 2) in mV versus time in ms. For the moving average calculation, compute the average value of the past 500 samples. Use a for or while-loop. Note that the moving average for the first 499 samples is equal to zero.

3.  For subplot 3 (lower left corner),  plot the LDV velocity signal in mm/s versus time in ms

4.  In subplot 4 (lower right corner), we want to plot the  integrated LDV signal in nm versus time in ms. To obtain the displacement signal in mm, integrate the LDV velocity signal by using the following command line detrend(cumsum(dataOfChannel3))/ Fs;

where Fs  denotes the sampling frequency at which the data was acquired.  Fs  can be calculated from the time vector (column 1) via 
Fs = 1/(t(2)-t(1))

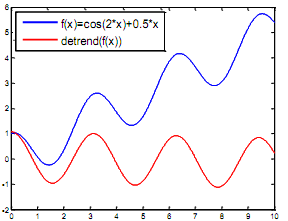
where t represents the time vector. 'cumsum' computes the cumulative sum of the elements. For instance, cumsum([1 2 3]) = [1 (1+2) (1+2+3)] = [1 3 6]. 'detrend' removes the linear trend from a vector, as shown in the figure below.

1433_Data manipulation.png


Related Discussions:- Data manipulation

Determine household production from the national accounts, What have been s...

What have been some justifications given for the historical exclusion of household production from the national accounts? Some reasons have included: a. households are not p

Production, when average product is decreasing, marginal product is?

when average product is decreasing, marginal product is?

Production , Suppose that a firm’s production function is given by Q=30L-3L...

Suppose that a firm’s production function is given by Q=30L-3L2, where L is labor input and Q is the output. a) Derive and draw the firm’s demand for labor while the firm’s produ

Economic policy efficiently, Economic policy efficiently: The reason f...

Economic policy efficiently: The reason for poverty and misery in the developing countries is not essentially the lack of potentialities or resources, human or material, but t

The world bank, THE WORLD BANK: The World Bank is another of the 'Bret...

THE WORLD BANK: The World Bank is another of the 'Brettonwoods Twin Sisters'. The World Bank, as it obtains presently, is an  umbrella organisation, under which five different

Utility, if sabela can afford 4 trousers and 4 pairs of shoes.she could als...

if sabela can afford 4 trousers and 4 pairs of shoes.she could also use her entire budget to buy 8 trousers and 2 pairs of shoes.if the price of a trouser is 500 birr,how much is s

Contribution of capital accumulation, Question:  Explain the contribution ...

Question:  Explain the contribution of capital accumulation in the progress of an economy? Capital makes the technological progress of the economy possible. Different technol

The economy is in the steady state, Assume in the Solow growth model that s...

Assume in the Solow growth model that s=.25, n=.02, d=.08, and f(k)=k^3. A)    Assume that z=2.  What is the steady state level of capital per worker and consumption per worker?

Write Your Message!

Captcha
Free Assignment Quote

Assured A++ Grade

Get guaranteed satisfaction & time on delivery in every assignment order you paid with us! We ensure premium quality solution document along with free turntin report!

All rights reserved! Copyrights ©2019-2020 ExpertsMind IT Educational Pvt Ltd