Critique on Earmarking
Studying the working of earmarking in many OECD (organisation of economic cooperation and development) countries, Potter and Diamond (1999) pointed out that to ensure comprehensiveness and transparency, it is necessary to design a budget system with three key characteristics, viz. annuality, unity and universality. They point out that these three characteristics are essential to ensure that all proposals for government expenditure are forced to compete for resources. A positive point which emerges from this argument is that efficiency in expenditure should be ensured by proper targeting among the fund seeking institutions and establishments. By this argument, funding is given not as a subsidy but as an earmarked grant targeted to ensure efficient spending.
The characteristic of anuuality requires that the budget should be prepared every year, covering only one year, which is voted and executed every year based on performance and efficient spending. However, it is also criticised that the three principles are derived mainly from the macroeconomist’s concern for budgetary control with the fear that extra-budgetary funds (EBFs) into which earmarked funds are placed might diminish the government’s ability to control resource allocation. The guidelines of two major international financial institutions (IMF and World Bank) note that ‘EBFs generally refer to accounts of government transactions that are not included in budget totals and usually do not operate according to budgetary execution procedures. In other words,they are often set up and used for reasons not consistent with the principles of good governance’. Nonetheless, it is conceded that the case for earmarking is strong as it is not the existing financial resources that are earmarked, but new resources that are mobilised for the sake of primary education.
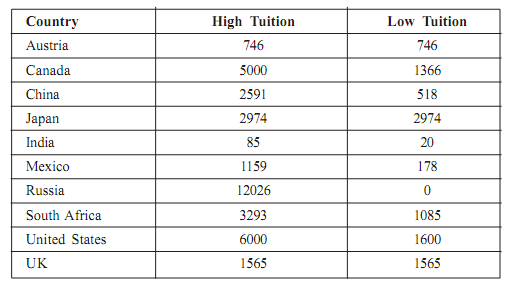
In an inter-country comparison on the tuition fees charged by different countries, Johnstone (2003) estimates that the cost of higher education in terms of tuition fees charged is far less in India than in many other countries (Table 16.12). It, however, needs to be noted that it does not reflect for the recent increases in the fees charged by institutions of higher learning. In addition, there is the more important factor of accessibility of higher education which is limited to about 7 per cent of relevant age-group in the Indian context. It is argued that developing countries require a rapid growth of good quality higher education for their very survival in the highly competitive globalised world. In this context, it is generally accepted that only those countries which are able to ensure a 20 per cent enrolment in higher education could become economically advanced. However, such an expansion backed only by low quality private funding (as in the case of most South American countries) has worked against the interests of development. It is relevant to note that even in a country like U.S. which is a high income market economy, expenditure on higher education to the extent of 80 per cent is made by public funding.
In several other advanced countries, higher education is supported by the state to the extent of 55-93 per cent of the total expenditure. For example, UK, Germany, Italy, Denmark, Austria, Netherlands and Sweden met more than 90 per cent of the expenditure on higher education in 1995. Canada, France and Hungary met between 80 to 90 per cent of the cost on higher education and Australia, Ireland, Spain, Mexico and Israel met between 70 to 80 per cent. As below table, in the late 1980s, in India, the corresponding proportion was between 75 and 80 per cent.
Table: Range of Tuition Fees (US $) Charged in Institutions of Higher Education