Cost-volume relationship, Civil Engineering

Assignment Help:

Cost-volume relationship:

Cost-volume relationship is illustrated through a simple example dealing with the cost of operating an automobile. To perform the analysis following cost regarding owning and operating an automobile is supposed.

2307_Cost-volume relationship.png

388_Cost-volume relationship1.png

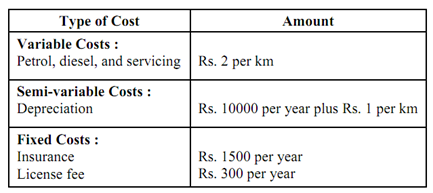
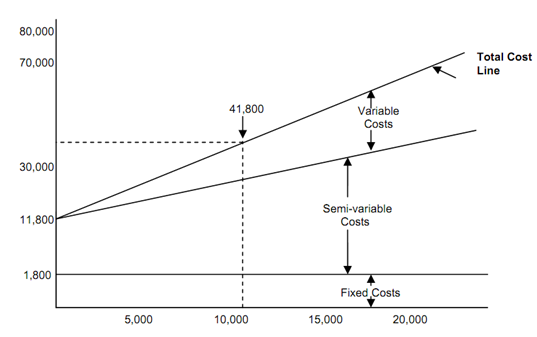
Figure: Cost Volume Relationship

The cost-volume-relationship may be expressed graphically. The relation among volume (miles per year) and different type of costs (that means. fixed, variable and semi variable) is illustrated in Figure

The estimated automobile cost per annum for any assumed mileage may be determined from the graph of total cost. For instance, to drive 10,000 km in a given year a total cost of Rs. 41800 or Rs. 4.18 per km is estimated. By combining all of the fixed and variable elements of the cost, the cost of owning an automobile can be estimated as Rs.11800 per year plus Rs. 3 per km driven during the year.

The effect of volume on unit (per km) costs may be calculated through the conversion of net costs into average costs as described below:

Cost per Mile of Owning and Using an Automobile


Miles driven                                    5,000          10,000         15,000            20,000

Costs:                                      

Completely variable (Rs. 2Per km)   10,000                   20,000        30,000           40,000

Semi variable:                                    

Variable part (Rs.1 per km)             5,000         10,000         15,000         20,000

Fixed part                                      10,000    10,000          10,000            10,000

Fixed Costs (1500 + 300)                1,800          1,800                1,800         1,800

Total Costs                                    25,800           41,800       56,800    71,800

Cost per km                                  5.16            4.18                3.78         3.59

From the aforementioned analysis it may be seen that the variable portion of the costs raise with the increase in volume but the rate of change in variable cost remains constant. On the other hand fixed costs remains constant with changes in distances traversed but reduce on a per km basis as number of kilometers increase.


Related Discussions:- Cost-volume relationship

Water sources and requirements, Water Sources and Requirements: In thi...

Water Sources and Requirements: In this part, we have discussed: (a) Basic concepts in planning of water supply schemes. (b) Various types of water requirement. (c) S

Explain sedimentation, Explain Sedimentation 1. Sedimentation bas...

Explain Sedimentation 1. Sedimentation basin or clarifier is used to remove particles that will settle in a reasonable time period 2. Basins are usually rectangular or

Explain the selected bridges - underwater inspection, Explain the Selected ...

Explain the Selected Bridges - Underwater Inspection? Those bridges, which require underwater inspection must be noted for individual inspection and inventory records as well b

Dissimilarities in function b/w rock anchors and rock socket, Question ...

Question What are main dissimilarities in function between rock anchors and rock sockets ? Answer Rock anchors are used first and foremost for resisting uplift forc

#title., desirable properties in green concrete

desirable properties in green concrete

Features of a stratigraphical survey phase, Features of a Stratigraphical S...

Features of a Stratigraphical Survey phase The principal features of a Stratigraphical Survey phase are: a)  Determination of depth of ground water, thickness, extent and ap

Distomat, short note of distomat

short note of distomat

Sketch typical complete grain-size distribution curves, Sketch typical comp...

Sketch typical complete grain-size distribution curves for (i) well graded soil and (ii) uniform silty sand. Form the curves, evaluate the uniformity coefficient and effective size

Explain the unit hydrograph method, Q.- Explain the Unit hydrograph Method ...

Q.- Explain the Unit hydrograph Method for estimation of peak flood discharge in a river. Ans.- Unit hydrograph Method A hydrograph is a representation of hydraulic cha

Write Your Message!

Captcha
Free Assignment Quote

Assured A++ Grade

Get guaranteed satisfaction & time on delivery in every assignment order you paid with us! We ensure premium quality solution document along with free turntin report!

All rights reserved! Copyrights ©2019-2020 ExpertsMind IT Educational Pvt Ltd