Comparison of GDP, NDP, GDI and NDI
Consider the case of Indonesia. During 1965-86 Indonesia greatly exploited its natural resource base to finance development expenditures. Revenues from production of oil, gas, hard minerals, timber and forest products have offset a large share of government expenditure. Primary production contributed more than 43 % of the GDP, 83 % of exports, and 55 % of total employment. Indonesia's economic performance over the period was judged to be good with per capita GDP growth averaging 4.6 % per year during 1965- 86.
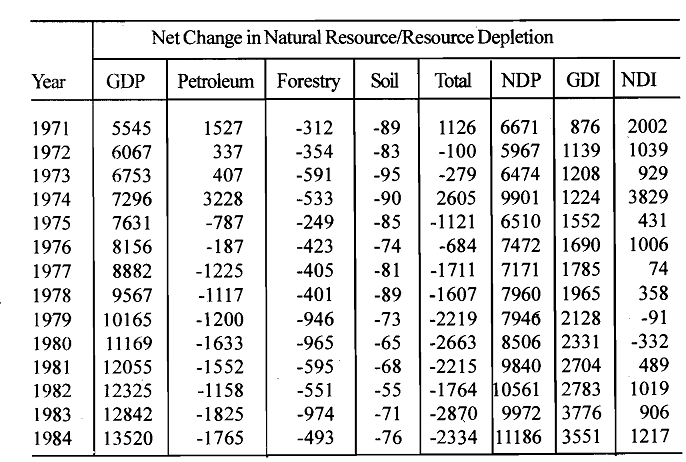
Gross domestic investment rose from 8 % of GDP in 1965 to 26 % in 1986. Estimates derived from Indonesian country study illustrate how much this evaluation is affected by keeping score correctly. The below table which compares the growth of GDP at constant prices with the growth of net domestic product (NDP), derived by subtracting estimates of net natural resource depreciation for only three sectors: petroleum, timber and soil. It is clear from the table that conventionally measured GDP substantially overstates net income and its growth. In fact, while GDP increased at an average annual rate of 7.1 % from 1971 to 1984, the estimate of NDP rose by only 4 % per year. The overstatement of income and its growth may actually be considerably more than these estimates indicate since only petroleum, timber and soil are covered. Other important exhaustible resources that have been exploited over the period, such as natural gas, coal, copper, tin, and nickel have not been included in the accounts. The depreciation of other renewable resources, such as non-timber forest products and fisheries is also not accounted for. When complete depreciation accounts are available, they will probably show a greater divergence between the growth in gross output and net income. The other important macroeconomic estimates are even more badly distorted as can be seen by comparing the estimates of gross domestic investment (GDI) and net domestic &vestment (NDI), the latter reflecting depreciation of natural capital.
This statistic is central to economic planning in resource-based economies. Countries such as Indonesia which are heavily dependent on exhaustible natural resources must diversify their asset base to preserve a sustainable long-term growth path. Extraction and sale of natural resources must finance investments in other productive capital. It is relevant, therefore, to compare gross domestic investment with the value of natural resource depletion. Should gross investment be less than resource depletion, then, on balance, the country is drawing down, rather than building up, its asset base, and using its natural resource endowment to finance current consumption. Should net investment be positive but less than required to equip new labour force entrants with at least the capital per worker of the existing labour force, then increases in output per worker and income per capita are unlikely. In fact, results from the Indonesian case-study show that the adjustment for natural asset changes is large in many years relative to gross domestic investment. In 197 1 and 1973, the adjustment is positive, because of additions to petroleum reserves. In most years during the period, though, the depletion adjustment offsets a good part of gross capital formation. In a number of years, net investment was negative. A fuller accounting of natural resource depletion might conclude that in many years depletion exceeded gross investment, implying that natural resources were being depleted to finance current consumption expenditures.
Table: Comparison of GDP, NDP, GDI and NDI
Such an evaluation should flash an unmistakable warning signal to economic policy-makers that they were on an unsustainable course. An economic accounting system that does not generate and highlight such evaluations is deficient as a tool for analysis and policy in resource-based economies and should be amended. A considerable and growing body of expert opinion has recognized the need to remove this anomaly from the accounting framework by accounting for depreciation of natural assets like depreciation of other physical capital. It is also recognized that the environmental considerations should be taken fully into account and in all countries, rich or poor; economic development must take full account in its measurements of growth of the improvement or deterioration in the stock of natural resources.
It is being largely accepted that GDP is essentially a short-term measure of economic activity for which exchange occurs in monetary terms. It is of limited usefulness to gauge long-term sustainable growth, partly because natural resource depletion and degradation are being ignored under current practices. A number of OECD member governments, including Canada, France, Netherlands, Australia and Norway, have carried on substantial work to compile accounts on n-a1 resource stocks and stock changes. France and Norway have made perhaps the most extensive official estimates. France's patrimony accounts have emphasized the development of physical accounts while Norway's resource accounts for energy and other significant economic resources have stressed integration with macroeconomic models and budgets. There is a detailed estimate of the national balance sheet of the US that includes values for timber and subsoil assets.