Combined mean and standard deviation -illustration, Mathematics

Assignment Help:

Combined mean

Assume m be the combined mean

Assume x1 be the mean of first sample

Assume x2 be the mean of the second sample

Assume n1 be the size of the 1st sample

Assume n2 be the size of the 2nd sample

Assume s1 be the standard deviation of the 1st sample

Assume s2 be the standard deviation of the 2nd sample

∴ Combine mean = (n1x1 + n2x2)/(n1n2)


                        2267_Combined mean.png


 Illustration

A sample of 40 electric batteries described a mean life span of 600 hours along with a standard deviation of 20 hours.

Other sample of 50 electric batteries described a mean lifespan of 520 hours along with a standard deviation of 30 hours.

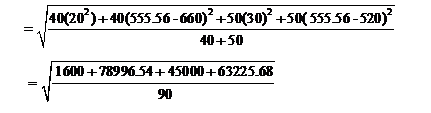
If these two samples were combined and utilized in a given project simultaneously, find out the combined new mean for the larger sample and hence find out the combined or pulled standard deviation.

                Size                    x                     s

               40(n1)              600 hours (x1)  hours (s1)

               50 (n1)             520 hours (x2)  30 hours (s2)

Combined mean = (40(600) + 50 (520))/(40 + 50)

=50,000/90

= 555.56

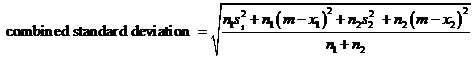
Combined standard deviation


              825_Combined mean 1.png


Related Discussions:- Combined mean and standard deviation -illustration

Ploting of mathematical graphs, how can we represent this mathematical equa...

how can we represent this mathematical equation on a graph y=2x-1

Exponets, what does the three mean in the power ?

what does the three mean in the power ?

Domain and range of a function , Domain and range of a functio:  One of th...

Domain and range of a functio:  One of the more significant ideas regarding functions is that of the domain and range of a function. In simplest world the domain of function is th

NOWA method, solve the equation 540+115 using the NOWA method

solve the equation 540+115 using the NOWA method

Area under curve, Write a program to find the area under the curve y = f(x)...

Write a program to find the area under the curve y = f(x) between x = a and x = b, integrate y = f(x) between the limits of a and b. The area under a curve between two points can b

Show frequency tables, Q. Show Frequency Tables? Ans. A frequency ...

Q. Show Frequency Tables? Ans. A frequency table is used to show how often a piece of data occurs. Example: Michelle decides to keep track of the number of phone call

Prove that prims algorithm produces a minimum spanning tree, Prove that Pri...

Prove that Prim's algorithm produces a minimum spanning tree of a connected weighted graph. Ans: Suppose G be a connected, weighted graph. At each iteration of Prim's algorithm

Calculate moving average, Calculate Moving Average The table given bel...

Calculate Moving Average The table given below represents company sales; calculate 3 and 6 monthly moving averages, for data Months Sales

Write Your Message!

Captcha
Free Assignment Quote

Assured A++ Grade

Get guaranteed satisfaction & time on delivery in every assignment order you paid with us! We ensure premium quality solution document along with free turntin report!

All rights reserved! Copyrights ©2019-2020 ExpertsMind IT Educational Pvt Ltd