Cash Flow Diagrams
We will use a cash flow approach to analyze the flow of money through out a planning horizon. A cash flow occurs when money actually change hands. We will use cash flow diagrams to assists us in analyzing cash flows that occur over several periods of time. A cash flow diagram using a sequential horizontal line as a time scale, and we will consider a positive cash flow as an inflow cash flow represented by an upwards arrow, and negative cash flow as an outflow cash flow represented by a downward arrow.
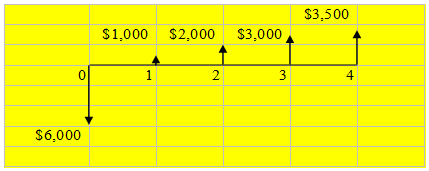
Example 1.1. You are opening a cheese steak hoagie fast food business to help you with your college. The projected cash flow for the "Cheese Steak Inc." is as follows:
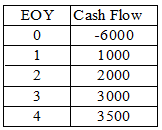
Draw a cash flow diagram for your cheese steak hoagie business:
In practice, cash flow can occur at the beginning, in the middle, or at the end of an interest period, or indeed at any point in the interest period. One of the simplifying assumptions that we make in economic analysis unless it is specified, is that the cash flow occur at the end of the interest period, or end-of-period convention. You will see in several text books and publications, the terms EOP (end of period), or EOY (en of year).
Note in example 1.1 that the cash flow starts with year zero, and that the initial investment occur at the end of year zero, which corresponds to the beginning of year 1. In this particular example, EOY (0) = BOY (1) corresponds to day one of your college years.
Example 1.2. A company deposit $100,000 during the first month of the year in an account with an interest period of one year and an interest rate of 10% per year. In this case, we will consider the deposit made at the end of year zero, which corresponds to beginning of year one. If we would consider the deposit occurring in year one using the EOY convention, we will not consider in the cash flow the interest generated during the first year that the money was deposited in the account.