Cash cycle, Cost Accounting

Assignment Help:

The Cash Cycle: so as to deal with the problem of cash management we should have a concept about the flow of cash by a firm's accounts. The entire process of such cash flow is identified as Cash Cycle. It has been demonstrated in the figures 2 and 3. Cash is used to purchase materials from that goods are produced. Production of such goods includes use of funds for paying wages and meeting the other expenses.

935_Cash Cycle.png

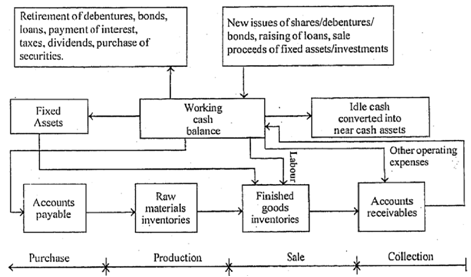
Figure: The cash cycle

748_Cash Cycle1.png

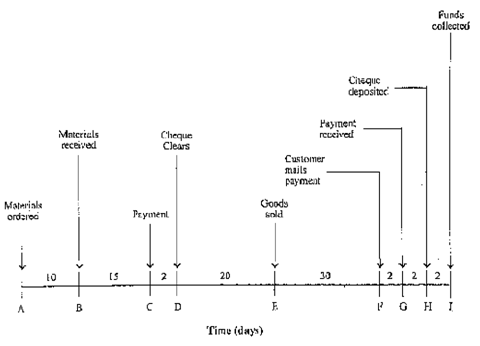
Figure: Details of the Cash Cycle

Goods generated are sold either on cash or credit. In the last case the pending bills are acquired at a later date. The firm hence receives cash instantly or later for the goods sold through it. The cycle keeps repeating itself.

The diagram in the figure 2 only provides a common idea about the channels of flow of cash in a business. In terms of time, the magnitude of the flow is depicted in the diagram specified in the figure 3. The subsequent information is reflected by the figure 3.

- Raw material for production is acquired 10 days after placement of order.

- The material is transformed in goods for sale in 37 days (15+2+20) from point of B to E.

- The payment for material purchased can be deferred to 17 days i.e. 15+2, after this is received that is the distance of time among points B to D, assuming that this takes 2 days for collection of payment of the cheque.

- The amount of the bill for goods sold is acquired 32 days (30+2) after the sale of goods as is depicted with duration of time among point E to G.

- The recovery of cash spent until point D is made after 56 days (20+30+2+2+2) as demonstrated between points D to J.


Related Discussions:- Cash cycle

Approach in cost accounting, Approach in Cost Accounting Cost accounti...

Approach in Cost Accounting Cost accounting is based on the framework or concept of cost centers that is all the costs incurred throughout the production process contain to be

Determine the joint cost, Determine the Joint Cost A company produces ...

Determine the Joint Cost A company produces three products, Y1, Y2, and Y3 in the similar process.  The data below reflects average monthly results as:

Motivation - behavioural aspects of standards, Motivation - Behavioural Asp...

Motivation - Behavioural Aspects of Standards Variance analysis and standards setting requires to be carried out like it motivates managers and other employees. It should not

Prepare cash budget of a company, Prepare Cash Budget of a Company The...

Prepare Cash Budget of a Company The given information concerned to the proposed budget for a company for the months ending on 31 December 1996. Additional Information

Target income calculations, Target Income Calculations Breaking even is...

Target Income Calculations Breaking even is not the bad thing, but surely not a satisfactory outcome for most businesses. In its place, a manager might be more interested in le

the refuse department , The CFO of ABC Municipality has heard of activity ...

The CFO of ABC Municipality has heard of activity based costing and wants to execute it in the municipality. Because ABC involves a number of changes to how service costs are deter

Calculate the break-even level of sales, Me ole cock spaniel plc. makes 3 p...

Me ole cock spaniel plc. makes 3 products, details as follows:   Apples (£)       Pears (£)         Cockneys (£)   Selling price        60               80

Explanation of total cost line, Total costs include both variable costs and...

Total costs include both variable costs and fixed costs. Variable costs are costs which can beeasily identified or related to a cost per unit or activity level of some kind for exa

What is chargeback, A process in the industry where a wholesaler needs an a...

A process in the industry where a wholesaler needs an amount that is the difference among the manufacturer's price to the wholesaler and the contract price to the resale customer.

Break-even chart, Break-Even Chart This is a diagrammatic presentation...

Break-Even Chart This is a diagrammatic presentation of the relationship among costs, prices, expenses and the sales volume. A break-even chart expresses revenue and expens

Write Your Message!

Captcha
Free Assignment Quote

Assured A++ Grade

Get guaranteed satisfaction & time on delivery in every assignment order you paid with us! We ensure premium quality solution document along with free turntin report!

All rights reserved! Copyrights ©2019-2020 ExpertsMind IT Educational Pvt Ltd