Calculating variance, Microeconomics

Assignment Help:

Calculating Variance (σ)

2297_variance.png

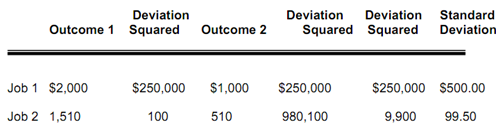
The standard deviations of the 2 jobs are:

1648_standard deviation.png

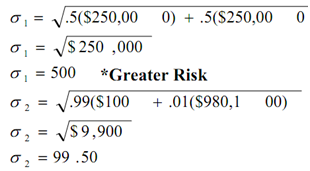
The standard deviation is used when there are several outcomes instead of only two.

* An Example

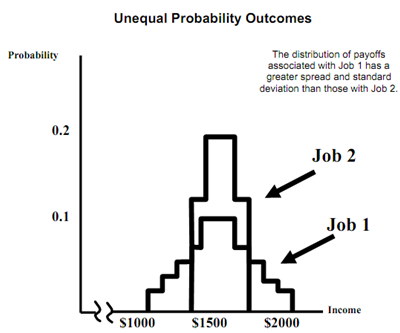
- Job 1 is a job in which income varies from $1000 to $2000 in increments of $100 which are all equally likely.

- Job 2 is a job in which income varies from $1300 to $1700 in increments of $100

that, are all equally likely.
1582_standard deviation1.png

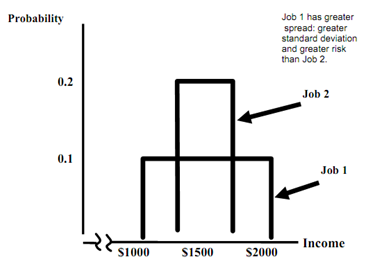
* Outcome Probabilities of Two Jobs

- Job 1: bigger spread and standard deviation

- The peaked distribution: extreme payoffs are much less probable 

*? Decision Making

- A risk avoider would select Job 2: same expected income as Job 1 with less risk.

- Assume that we add $100 to each payoff in Job 1 which makes expected payoff = $1600.

424_unequal probability outcomes.png

2220_unequal probability outcomes1.png

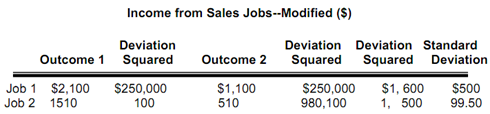
The standard deviation is square root of deviation squared.

*?  Decision making

- Job 1: the expected income is $1,600 and a standard deviation of $500.

- Job 2: the expected income of $1,500 and a standard deviation of $99.50

- Which job?

  • Greater value or less risk?

*? Example

- Suppose a city wants to deter people from wrong parking.

- The alternatives ......
*  Assumptions:

1) Wrong parking saves a person $5 in terms of time spent searching for a parking space.

2) The driver is risk neutral.

3) Cost of apprehension is zero.

*  A fine of $5.01 would deter the driver from double parking.

- Benefit of wrong parking ($5) is less than the cost ($5.01) equals the average benefit which is less than 0.

*  Increasing fine can reduce the cost of enforcement:

- A $50 fine with a .1 probability of being caught results in the expected penalty of $5.

- A $500 fine with a .01 probability of being caught results in the expected penalty of $5.

*  The more risk reluctant drivers are, lower the fine is required to be in order to be effective.


Related Discussions:- Calculating variance

Graphing, I can''t figure out how to graph the aggregate consumption functi...

I can''t figure out how to graph the aggregate consumption function and the aggregate saving function

#title.demand curve, Plot the demand schedule and draw the demand curve for...

Plot the demand schedule and draw the demand curve for the data given for Marijuana in the case above.

What do you mean by consumption set, What do you mean by Consumption Set? ...

What do you mean by Consumption Set? Consumption Set: We notice a consumer faced along with possible consumption bundles within consumption set X. We generally assume that X

Describe consumer price index, Q. Describe Consumer Price Index? Consum...

Q. Describe Consumer Price Index? Consumer Price Index:Consumer price index (CPI) is a measure of overall price level paid by consumers for various services and goods they purc

Economic situation - ae model, "Describe the current Australian economic si...

"Describe the current Australian economic situation and support your claims with relevant economic indicators and variables.  The RBA has maintained the cash rate of 4.75% for the

Nash equilibrium, Think of the Golden Ball game. Now player 1 is money-mind...

Think of the Golden Ball game. Now player 1 is money-minded and jealous, and player 2 is very good-hearted, so the payoff matrix is follows:                                Playe

Point elasticity of demand, solution for -calculate price elasticity of dem...

solution for -calculate price elasticity of demand for demand function Q= 10 - 2p for decrease in price from Rs. 3 to Rs.2

Write Your Message!

Captcha
Free Assignment Quote

Assured A++ Grade

Get guaranteed satisfaction & time on delivery in every assignment order you paid with us! We ensure premium quality solution document along with free turntin report!

All rights reserved! Copyrights ©2019-2020 ExpertsMind IT Educational Pvt Ltd