Biological model, Public Economics

Assignment Help:

Biological Model

The most commonly used model of biological population is based on logistic growth model in which population is assumed to grow as a 'logistic curve' over time. In this model,  the population grows rapidly  in the early  stages as the abundance  of  food is more and  then the growth  rate slows down  and  then approaches asymptotically a level which is equal to its carrying capacity.

220_Biological Model.png

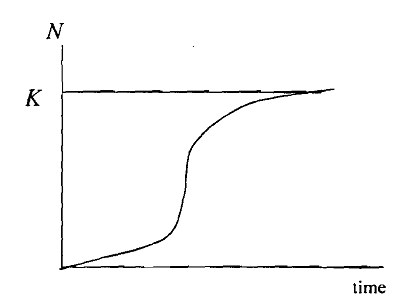
Diagram: Logistic Growth Curve

Observe that when plotted on graph the logistics curve is 'S' shaped and is given By

503_Biological Model 2.png

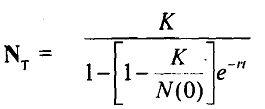
Where Nt is the number of organisms at a point of time t,

K is the carrying capacity, and

'r'  is maximum intrinsic per capita growth rate of population.

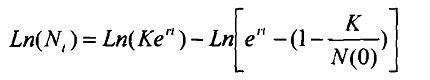
As the curve shows, the population initially increases at an  increasing rate and reaches a point at which the growth is maximum and after that, the growth is at a decreasing rate and then finally the growth stops when the population reaches the limit known as 'carrying capacity'. This indicates a limit of the stock, which is supported by a given habitat. By taking logarithm on both sides and differentiating, we obtain the growth rate.

By taking the logarithm of the logistic curve we obtain,

Equation 1

1110_Biological Model 3.png

By differentiating the above we obtain

Equation 2

1021_Biological Model 4.png


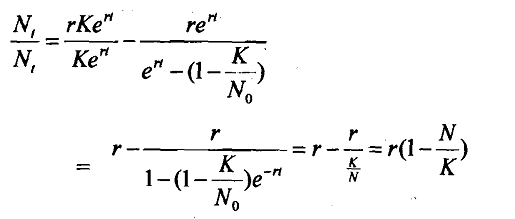
Here Nt is instantaneous rate of change of stock. When N approaches K, i.e., the carrying capacity, the effective per capita increase Nt/Nt declines linearly towards zero.

Nt= F (N) - h (t) where F (N) is natural growth rate.

The problem is to determine what pattern of harvest rates over time would cause the stocks to change in such a way as to maximize the value of yield it provides.


Related Discussions:- Biological model

Bowling Alone, What are your thoughts on Putman’s “Bowling Alone,” the idea...

What are your thoughts on Putman’s “Bowling Alone,” the idea that there has been a decline in social capital in North America? Do you agree or disagree with the assertion? Support

Uncertainty and the policy process, As we know now that in policy process, ...

As we know now that in policy process, policy outcome may differ from the social planner outcome not only because different policies may be chosen but because a given policies may

Development of green indicators , Development of Green Indicators ...

Development of Green Indicators Normal 0 false false false EN-IN X-NONE X-NONE MicrosoftInternetExplorer4

Pareto graphs, explanation and justify the condition of pareto optimality a...

explanation and justify the condition of pareto optimality and verify the defination of contrect curve. statment; reallocation of the resources from 1 efficient point to another ef

Contingent ranking method, Normal 0 false false false E...

Normal 0 false false false EN-IN X-NONE X-NONE MicrosoftInternetExplorer4

Factors for evaluating a policy instrument, Normal 0 false fa...

Normal 0 false false false EN-IN X-NONE X-NONE MicrosoftInternetExplorer4

Explain what is economic growth, Question 1: i. Explain the likely effe...

Question 1: i. Explain the likely effects of a recession on a government's budget? ii. How is the operation of fiscal policy supposed to affect the level of economic activ

Welfare foundations of economic policies, The term Public Economics came in...

The term Public Economics came into existence only in 1960s however a few titleswith nomenclature such as Public Finance had already started covering much ground,which is today cov

Write Your Message!

Captcha
Free Assignment Quote

Assured A++ Grade

Get guaranteed satisfaction & time on delivery in every assignment order you paid with us! We ensure premium quality solution document along with free turntin report!

All rights reserved! Copyrights ©2019-2020 ExpertsMind IT Educational Pvt Ltd