Bezier Surfaces - Modeling and Rendering
Two sets of Bezier curve can be utilized to design an object surface by identifying by an input mesh of control points. The Bézier surface is termed as the cartesian product of the blending functions of 2 Bézier curves.

Here with p j,k identifying the location of the (m + 1) with (n + 1) control points.
The consequent properties of the Bézier curve implemented to the Bézier surface.
The surface doesn't in common pass via the control points except for the corners of the control point grid.
The surface is contained inside the convex hull of the control points.

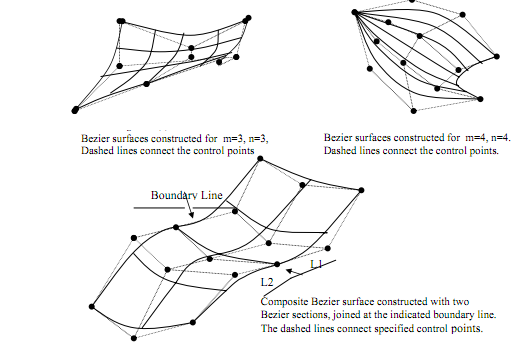
The control points are linked via a dashed line, and solid lenes demonstrates curves of constant u and v. All curves is plotted by varying v over the interval by 0 to 1, along with u fixed at one of the values in this sections interval curves of constant v are then plotted.
Here figures (a), (b), (c) demonstrate Bezier surface plots. The control points are linked by dashed lines and the solid lines demonstrate curves of constant u and v also. All the curve of constant u is plotted via varying v over the interval start 0 to 1, along with u fixed at one of the values in this single interval. Curves of constant v are plotted likewise.

In above figure (c) first-order continuity is established via making the ratio of length L1 to length L2 constant for all collinear line of control points after the boundary in between the surface sections. As in figure (c) demonstrates also a surface formed along with two Bezier sections. Since with curves, a smooth transition from one part to another is assured via establishing both zero-order and first-order continuity on the boundary line. Zero-order continuity is acquired by matching control points at the boundary. So first-order continuity is acquired by choosing control points along a straight line across the boundary and via keeping a constant ration of collinear line segments for every set of identified control points across section boundaries.