Animation, MATLAB in Mathematics

Assignment Help:

Animation:

In this part we will observe a couple of ways to animate a plot. These are visuals, therefore the outcomes can't really be shown here; it is essential to type these into a MATLAB to view the results.

We begin by animating a plot of sin(x) with the vectors:

>> x = -2*pi : 1/100 : 2*pi;

>> y = sin(x);

This results in sufficient points that we will be able to view the result by using the built-in comet function, that shows the plot by first displaying the point (x(1),y(1)), and then moving on to the point (x(2),y(2)), and so forth, leaving a trail of all the earlier points.

   >> comet(x,y)

The final result looks similar as plot(x,y).

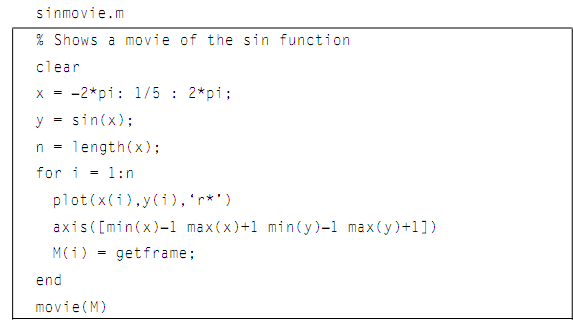
The other way of animating is to use the built-in function movie that shows recorded movie frames. The frames are captured in a loop by using the built-in function getframe, and are stored in the matrix. For illustration, the script below again animates the sin function. The axis function is used so that the MATLAB will use similar set of axes for all frames, and by using the min and max functions on the data vectors x & y will permit us to see all points.

It shows movie once in the for loop, and then again whenever the movie function is called.

2091_Animation.png


Related Discussions:- Animation

Algebra, 5 p2+8p+15, 3 p2-3p-18, 12 p...

5 p2+8p+15, 3 p2-3p-18, 12 p2-p-30

Script a MATLAB program, Script a MATLAB program which meets the following ...

Script a MATLAB program which meets the following speci cations: The program expects an input of a two-variable real-valued continuous function f : R^2--> R The program is to cal

Types of user-defined functions, Types of User-defined Functions: We k...

Types of User-defined Functions: We know how to write a user-defined function, stored in an M-file, which computes and returns one value. This is merely one type of the functi

Plot types - plot functions, Plot types: Besides plot and bar, there a...

Plot types: Besides plot and bar, there are another plot types like stem plots, histograms, stem plots, area plots and pie charts, and also other functions which customize the

Bar and barh functions - plot functions, bar and barh functions: For a...

bar and barh functions: For a matrix, the bar and barh functions will group altogether the values in each and every row. The illustration is as shown: rm = randint(2,4,[1

Looping, How do I write a product series running from i to n of x''s using ...

How do I write a product series running from i to n of x''s using a for loop?

Illustration of writing variables to a file, Illustration of Writing variab...

Illustration of Writing variables to a file: For illustration, in the below session in the Command Window, 3 variables are generated; these are then exhibited using who. Then,

Blanks function, Blanks function: The blanks function will generate a ...

Blanks function: The blanks function will generate a string consisting of n blank characters-that are kind of hard to see here! Though, in a MATLAB if the mouse is moved to hi

Using functions with the vectors and matrices, Using Functions with the Vec...

Using Functions with the Vectors and Matrices: As MATLAB is written to work with the vectors and matrices, the whole vector or matrix can be passed as an argument to the funct

Customizing plots, Customizing Plots : There are numerous ways to custo...

Customizing Plots : There are numerous ways to customize figures in the Figure Window. On clicking the Plot Tools icon will bring up the Property Editor & Plot Browser, with ma

Write Your Message!

Captcha
Free Assignment Quote

Assured A++ Grade

Get guaranteed satisfaction & time on delivery in every assignment order you paid with us! We ensure premium quality solution document along with free turntin report!

All rights reserved! Copyrights ©2019-2020 ExpertsMind IT Educational Pvt Ltd