Aggregate supply - long run equilibrium:graphical analysis, Macroeconomics

Assignment Help:

Long Run Equilibrium:Graphical Analysis

In the long run the natural rate of output is the level of output to which the economy will tend to adjust in the long run. This indicates that in the long run the average price level has no effect on the level of output (Y). As discussed earlier, any unanticipated price rise in the short run will be offset in the long run by an increase in costs as contracts with the suppliers of inputs are renegotiated. Therefore, in the long run the output of an economy does not depend on the price level, but on factors such as, labor import costs, capital stock, technological progress, etc. These factors are not influenced by changes in the average price level and so is the case with aggregate supply in the long run. Therefore, as shown in figure 6.5, in the long run the aggregate supply curve of an economy is vertical at the natural rate of output.

Figure shows the relationship among aggregate demand curve (AD), the short run aggregate supply curve (AS) and the long run aggregate supply curve (ASL). The output demanded and supplied per period of time, say per year, are designated by Q. Recall that the natural rate of output (Q) is not the same as the level of output achieved in the short run when all resources are fully employed. At this level of output there are unemployed resources caused by lack of mobility and other labor market rigidities which cannot be reduced by raising aggregate demand.

Figure: Aggregate Supply in the short run and in the long run

487_aggregate supply in short and long run.png


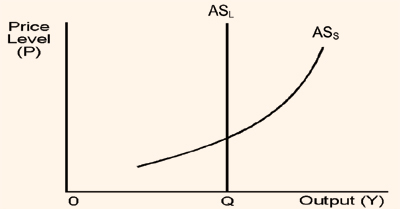
Figure: Short Run and Long Run Equilibrium between Aggregate Demand and Aggregate Supply

1994_aggregate supply in short and long run1.png

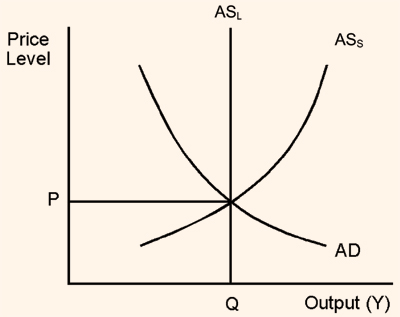
It is shown that as long as aggregate demand and aggregate supply conditions for the natural rate of output continue to be those represented by the AD, ASS and ASL curves the market for this output can be in equilibrium condition provided the output actually supplied and demanded is at Q and the price is P. Only this combination of price level (P) and quantity demanded (Q) will clear the market, leaving no excess supply or no excess demand.

From this analysis, there are at least two important points that will be useful for our later analysis. They are (i) market equilibrium is not determined by aggregate demand conditions alone, not by supply conditions alone, but by a combination of both (ii) both the price level and the natural rate of output and sales are determined simultaneously.


Related Discussions:- Aggregate supply - long run equilibrium:graphical analysis

Indicate the beginnings, Which of the following would indicate the beginnin...

Which of the following would indicate the beginnings of an expansion of the economy? a. Fewer new firms are started. b. Stock market prices decline c. Consumer confidence improves

The core of macroeconomics, Suppose in the Republic of Madison that the reg...

Suppose in the Republic of Madison that the regulation of banking rested with the Madison Congress, including the determination of the reserve ratio. The Central Bank of Madison is

Define mortgage, When did mortgage? Default and housing foreclosure rates b...

When did mortgage? Default and housing foreclosure rates begin to rise rapidly? When did the economy go into recession? Was there a causal relationship between the two? Discuss.

What are the slopes of demand curves, Use the points on the graph below to ...

Use the points on the graph below to answer the following questions. i)   What is Ep along D1 (from A to B)? ii)  What is the Ep along D2 (from X to Y)? iii) What are

Permanet inocme, if your earning records over year has been:Yt=$40000 Yt-1=...

if your earning records over year has been:Yt=$40000 Yt-1=$38000 Yt-2=34000 Yt-3=$32000 YT-4=31000,What is the your permanet income?

Mutual funds was taken, A sample of 57 mutual funds was taken and the mean ...

A sample of 57 mutual funds was taken and the mean return in the sample was 14.1% with a standard deviation of 9.2%. The return on a particular index of stocks (against which the m

Implement sap to improve processes, Explain how a Fortune 500 company has b...

Explain how a Fortune 500 company has been able to implement SAP to improve their processes. Suppose the supply function for product X is given by Qsx = -50 + 0.5Px - 5Pz. A.

Define the monopoly of central banks, Define the monopoly of Central banks ...

Define the monopoly of Central banks The central bank has a monopoly on issuing currency, it is in complete control of the monetary base. In section 7.4.2 we will describe exac

Relationship with 8 variants of national product aggregates, RELATIONSHIP W...

RELATIONSHIP WITH 8 VARIANTS OF NATIONAL PRODUCT AGGREGATES  We have shown the distinction between national product at market prices and national product at factor cost, based

Write Your Message!

Captcha
Free Assignment Quote

Assured A++ Grade

Get guaranteed satisfaction & time on delivery in every assignment order you paid with us! We ensure premium quality solution document along with free turntin report!

All rights reserved! Copyrights ©2019-2020 ExpertsMind IT Educational Pvt Ltd