Write the null hypotheses for a parametric hypothesis test

Assignment Help Applied Statistics
Reference no: EM131954874

Introduction to Biostatistics Assignment -

Please answer all 7 questions. Some of the questions require you to analyse the unique assignment data set which I have created for you. This is labelled 'dataforxxxxxxxx.RData' where xxxxxxxx represents your Student ID number. You can find this with your Assessment materials in vUWS. Please also locate and read 'Description of your data set.docx'. Note: Each student will get different answers as the data sets differ.

Question 1 - A random sample of 10 former University of Eastern Sydney students was ask whether they drink more or less since they graduated from University. Their answers were:

more, less, less, less, more, less, less, less, less, more

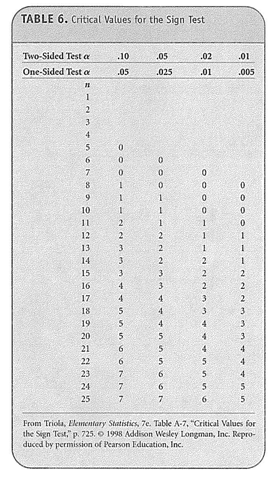
Conduct a sign test to see whether or not this provides evidence of a change in drinking habits of the wider population of graduates from University of Eastern Sydney. Use the 5-step method and show all working. Use the Table 6 from the textbook (below) to determine the decision rule or use R Commander to calculate the p-value.

700_figure.png

Question 2 - Research question: What is the mean well-being (WEMWBS) score for University of Eastern Sydney Students?

Using the University of Eastern Sydney data set assigned to you and R Commander:

a. Calculate the 95% confidence interval for the mean well-being (WEMWBS) score in this population.

b. Write a sentence which answers the research question above as fully as possible.

This research question applies to questions 3 and 4

Research question: Among University of Eastern Sydney students, do self-reporting drug users (variable: drug) have lower well-being scores (variable: WEMWBS) than non-users?

Question 3 - Would you address this research question with a one-tailed hypothesis test or a two-tailed hypothesis test? Explain why.

Write the null and alternate hypotheses for a parametric hypothesis test, fully defining any symbols which you use.

Using the University of Eastern Sydney data set assigned to you and R Commander find and report

i. the mean wellbeing (WEMWBS) score for drug users in the sample

ii. the mean wellbeing (WEMWBS) score for non-users in the sample

iii. the p-value for the difference in mean wellbeing (WEMWBS) between these two groups in the population

Based on the results of c) provide your answer to the research question.

Question 4 - Conduct an equivalent nonparametric hypothesis test for this research question. Please use R Commander for all calculations, but follow the 5 step method in your presentation.

Question 5 - Suppose that the WEMWBS wellbeing score had been designed to be Normally distributed with a mean μ = 44 and standard deviation σ = 4. Suppose we wished to undertake a study to test whether the mean wellbeing (WEMWBS) score of Western Sydney University students was at least half a standard deviation better than average. Suppose we wished the test to return 90% power of detecting a difference of this size at the α = 0.05 significance level. Use an appropriate online calculator to calculate the minimum required sample size for this study. Present your answer as a sentence which details the required sample size to achieve what power subject to what conditions.

Question 6 - Research question: Does the proportion of students self-reporting as illicit drugs users differ by gender in the University of Eastern Sydney population?

Using the University of Eastern Sydney data set assigned to you and R Commander:

a. Show the relationship between illicit drug use and gender using a two-way contingency table. Include either row or column percentages. Type and label the table yourself; an R Commander screenshot will not be accepted.

b. Are the requirements for a Chi-square test met? Explain why.

c. Irrespective of your answer in part b. address the research question using a Chi-square test. Ensure you specify the hypotheses you are testing and explain the evidence for or against the hypothesis.

Question 7 - Estimate the minimum sample size required to produce a 95% confidence interval with a margin of error of ±4% for the proportion of illicit drug users among Western Sydney University students. Present your answer as a sentence which summarises the required sample size to achieve what confidence level subject to what conditions.

Attachment:- Assignment Files.rar

Reference no: EM131954874

Questions Cloud

What is the maximum dollar purchase you can make : If the initial margin requirement is 55 percent, what is the maximum dollar purchase you can make? with explain please.
Find the combined average costs of two nearby competitors : Calculate the difference between the percentage values of the average costs of the merged firms and the combined average costs of two nearby competitors.
How much of cash flow is return on investment : how much of each year’s cash flow is recovery of the $13,000 investment and how much of the cash flow is return on investment
Calculate the required rate of return : Calculate the required rate of return for Mudd Enterprises assuming that investors expect a 4.1% rate of inflation in the future.
Write the null hypotheses for a parametric hypothesis test : 401077 Introduction to Biostatistics Assignment - Write the null and alternate hypotheses for a parametric hypothesis test, fully defining any symbols
What would be the required rate of return : If the value of a common stock was $97 per share and dividends were recently $2.80, but expected to grow at 4% per year, what would be the required rate.
What will be the price of carmine stock in five years : Carmine Co. stock will pay a $4 dividend next year (D_1 = $4). After next year's dividend, the dividends will grow at a 5% rate for the following two years.
Find what is the present value of the car payments : A car dealership offers you no money down on a new car. You may pay for the car for 4 years by equal monthly end-of-the-month payments of $648 each.
Find percentage values of average costs of the merged firms : Calculate the difference between the percentage values of the average costs of the merged firms and the combined average costs of two nearby competitors.

Reviews

len1954874

4/24/2018 12:34:04 AM

Please answer all 7 questions. Record your answers in the template document provided and submit via Turnitin before 11:59pm on the due date. The marks allocated to each question are shown in the assignment. A total of 30 marks are available and this assignment is worth 30% of your overall grade. Some of the questions require you to analyse the unique assignment data set which I have created for you. This is labelled ‘dataforxxxxxxxx.RData’ where xxxxxxxx represents your Student ID number. You can find this with your Assessment materials in vUWS. Please also locate and read ‘Description of your data set.docx’. Note: Each student will get different answers as the data sets differ.

Write a Review

Applied Statistics Questions & Answers

  Hypothesis testing

What assumptions about the number of pedestrians passing the location in an hour are necessary for your hypothesis test to be valid?

  Calculate the maximum reduction in the standard deviation

Calculate the maximum reduction in the standard deviation

  Calculate the expected value, variance, and standard deviati

Calculate the expected value, variance, and standard deviation of the total income

  Determine the impact of social media use on student learning

Research paper examines determine the impact of social media use on student learning.

  Unemployment survey

Find a statistics study on Unemployment and explain the five-step process of the study.

  Statistical studies

Locate the original poll, summarize the poling procedure (background on how information was gathered), the sample surveyed.

  Evaluate the expected value of the total number of sales

Evaluate the expected value of the total number of sales

  Statistic project

Identify sample, population, sampling frame (if applicable), and response rate (if applicable). Describe sampling technique (if applicable) or experimental design

  Simple data analysis and comparison

Write a report on simple data analysis and comparison.

  Analyze the processed data in statistical survey

Analyze the processed data in Statistical survey.

  What is the probability

Find the probability of given case.

  Frequency distribution

Accepting Manipulation or Manipulating

Free Assignment Quote

Assured A++ Grade

Get guaranteed satisfaction & time on delivery in every assignment order you paid with us! We ensure premium quality solution document along with free turntin report!

All rights reserved! Copyrights ©2019-2020 ExpertsMind IT Educational Pvt Ltd