Reference no: EM131931057
Regression Analysis - Estimating Relationships Assignment
I. Oil Problem - A small sample data is collected for two variables. Y represents the price of all gas types per gallon (Bureau of Labor Statistics), and X represents the average price of crude oil per barrel (Department of energy), for a period of ten years.
|
Yr
|
y
|
x
|
|
2000
|
1.56
|
27.39
|
|
2001
|
1.53
|
23.00
|
|
2002
|
1.44
|
22.81
|
|
2003
|
1.64
|
27.69
|
|
2004
|
1.92
|
37.66
|
|
2005
|
2.34
|
50.04
|
|
2006
|
2.63
|
58.30
|
|
2007
|
2.85
|
64.20
|
|
2008
|
3.32
|
91.48
|
|
2009
|
2.40
|
53.48
|
1. Plot the Scattergram.
2. Fit a model that best fits the data, using Least Squares Method and obtain the summary output.
3. Write the Least Squares equation.
4. Predict the price of gas at the pump in a year in which the price of crude oil is $100 per bbl.
5. Superimpose the Least Squares Line in the scatter diagram above.
6. Interpret the intercept and slope in the context of the problem.
7. What is the value of SSE and what does it mean?
8. What is the value of the variance of regression, S2, and what does it mean in the context of the problem. What other notation (abbreviation) is used to represent the variance of regression?
9. What is the value of S, the standard error of estimate, and explain its meaning.
10. What is the value of the coefficient of correlation and what does it mean in the context of the Problem.
11. Compute the coefficient of determination and interpret its meaning in the context of the problem.
Note that the above are not steps required in every regression analysis. These are just some questions posed in this problem.
II. A random sample of ten used cars (Corvettes) between 1 and 6 years old were selected from a used car dealership. The following data were obtained, x represents age, in years, and y represents sales price, in hundreds of dollars.
|
x
|
6
|
6
|
6
|
4
|
2
|
5
|
4
|
5
|
1
|
2
|
|
y
|
125
|
115
|
130
|
160
|
219
|
150
|
190
|
163
|
260
|
260
|
1. Graph the data in a scatterplot to determine whether there is a possible linear relationship between the two variables. Draw the proposed model in the scatter diagram.
2. Fit a linear model to the data.
3. Write the least squares equation.
4. Interpret the regression coefficients in the context of the problem.
5. What is the value of the correlation coefficient? What does it mean in terms of the strength and nature of the relationship between the two variables?
6. Compute and interpret the coefficient of determination. Interpret its meaning.
7. Based on the coefficient of determination and the standard error of estimate, how good is the model?
III. To predict the peak power load needed, ABC Power Authority has selected a sample of 6 summer days. The data are listed below:
|
Temperature degrees "F"
|
Peak Load Megawatts
|
|
67
|
97.0
|
|
108
|
190.1
|
|
86
|
105
|
|
100
|
159.1
|
|
90
|
132.1
|
|
76
|
101.0
|
1. Construct a scatterplot for the data and graph a second-order polynomial.
2. Fit a second-order model to the data.
3. Write the least squares equation.
4. What is the SSE and what does it mean?
5. What is the S2, and what does in mean.
6. What is the standard error of estimate and what does it mean.
7. What is the coefficient of determination and what does it mean in the context of this problem.
8. Predict the peak power load needed in a day in which temperature is 105 degrees.
IV. The Quality of a product depends on temperature and Pressure (in PSI). Use the 27 observations in the table and answer the following questions:
|
Quality
|
Temp
|
PSI
|
|
Quality
|
Temp
|
PSI
|
|
50.80
|
80
|
50
|
|
97.40
|
90
|
55
|
|
50.70
|
80
|
50
|
|
70.90
|
90
|
60
|
|
49.40
|
80
|
50
|
|
68.80
|
90
|
60
|
|
93.70
|
80
|
55
|
|
71.30
|
90
|
60
|
|
90.90
|
80
|
55
|
|
46.60
|
100
|
50
|
|
90.90
|
80
|
55
|
|
49.10
|
100
|
50
|
|
74.50
|
80
|
60
|
|
46.60
|
100
|
50
|
|
73.00
|
80
|
60
|
|
69.80
|
100
|
55
|
|
71.20
|
80
|
60
|
|
72.50
|
100
|
55
|
|
63.40
|
90
|
50
|
|
73.20
|
100
|
55
|
|
61.60
|
90
|
50
|
|
38.70
|
100
|
60
|
|
63.40
|
90
|
50
|
|
42.50
|
100
|
60
|
|
93.80
|
90
|
55
|
|
41.40
|
100
|
60
|
|
92.10
|
90
|
55
|
|
|
|
|
1. Fit a first-order model to the data (make sure you include both independent variables.)
2. Report the equation of the model.
3. Interpret the estimated regression coefficients.
4. Report the coefficient of determination and the standard error of estimate for the first-order model. Based on these, how good is the model?
5. Fit an interaction model to the data.
6. Report the coefficient of determination and the standard error of estimate for the interaction model. Based on these, how good is the model?
7. Fit a complete second-order model to the data.
8. Report the coefficient of determination and the standard error of estimate for the complete second-order model. Based on these, how good is the model?
9. Which of the three models do you prefer? Why? Explain.
V. Part of an Excel output relating X (independent Variable) and Y (dependent variable) is shown below. Fill in all the blanks marked with "?".
Note: Please have your formula sheet handy and watch the "Regression Output Analysis" Excel Video demo file, under the Excel link, before attempting this and next problems.
Hint: MSE = (Standard error of estimate)2
Summary Output
|
Regression Statistics
|
|
|
Multiple R
|
?
|
|
R Square
|
0.980237
|
|
Adjusted R Square
|
?
|
|
Standard Error
|
0.096067
|
|
Observations
|
10
|
ANOVA
|
df
|
SS
|
MS
|
F
|
Significance F
|
|
Regression
|
?
|
?
|
?
|
?
|
0.0000
|
|
Residual
|
?
|
?
|
?
|
|
|
|
Total
|
?
|
3.73581
|
|
|
|
|
|
|
|
|
|
|
Coefficients
|
Standard Error
|
t Stat
|
P-value
|
|
|
Intercept
|
?
|
0.072432
|
11.77961
|
0.0000
|
|
|
x
|
?
|
0.001442
|
19.91967
|
0.00000
|
|
VI. Part of an Excel Summary Output relating X (independent Variable) and Y (dependent variable) is shown below. Fill in all the blanks marked with "?".
Summary Output
|
Regression Statistics
|
|
|
Multiple R
|
0.1347
|
|
R Square
|
?
|
|
Adjusted R Square
|
?
|
|
Standard Error
|
3.3838
|
|
Observations
|
?
|
ANOVA
|
df
|
SS
|
MS
|
F
|
Significance F
|
|
Regression
|
?
|
2.7500
|
?
|
?
|
0.632246859
|
|
Residual
|
?
|
?
|
11.45
|
|
|
|
Total
|
14
|
?
|
|
|
|
|
|
|
|
|
|
|
Coefficients
|
Standard Error
|
t Stat
|
P-value
|
|
|
Intercept
|
8.6
|
2.2197
|
?
|
0.0019
|
|
|
x
|
0.25
|
0.5101
|
?
|
0.6322
|
|
VII. A chain of clothing stores wants do develop a model that can predict sales based the store's location. A sample of past December sales in the four stores is given below
|
Store
|
2011
|
2010
|
2009
|
2008
|
2007
|
|
1
|
31
|
41
|
39
|
36
|
32
|
|
2
|
24
|
31
|
34
|
28
|
23
|
|
3
|
54
|
60
|
57
|
52
|
62
|
|
4
|
34
|
42
|
40
|
46
|
47
|
1. How many independent variables are needed in this problem?
2. Identify the coding scheme (introduce dummy variables and define them).
3. Propose a model that can show this relationship.
4. Fit the model to the data of the problem.
5. Make interpretation of all coefficients in the problem.
6. Graph the model.
VIII. A fast food restaurant chain is interested in modeling the mean weekly sales of a restaurant, E(y), as a function of the weekly traffic flow on the street where the restaurant is located and the city in which the restaurant is located. The table contains data that were located on 24 restaurants in four cities. The model that has been proposed is
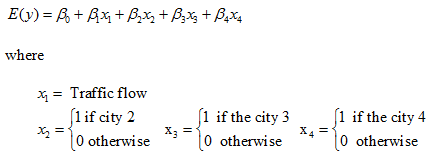
|
CITY
|
TRAFFIC FLOW (thousands of cars)
|
WEEKLY SALES y($ thousands)
|
|
CITY
|
TRAFFIC FLOW (thousands of cars)
|
WEEKLY SALES y($ thousands)
|
|
1
|
59.3
|
6.3
|
|
3
|
75.8
|
8.2
|
|
1
|
60.3
|
6.6
|
|
3
|
48.3
|
5.0
|
|
1
|
82.1
|
7.6
|
|
3
|
41.4
|
3.9
|
|
1
|
32.3
|
3.0
|
|
3
|
52.5
|
5.4
|
|
1
|
98.0
|
9.5
|
|
3
|
41.0
|
4.1
|
|
1
|
54.1
|
5.9
|
|
3
|
29.6
|
3.1
|
|
1
|
54.4
|
6.1
|
|
3
|
49.5
|
5.4
|
|
1
|
51.3
|
5.0
|
|
4
|
73.1
|
8.4
|
|
1
|
36.7
|
3.6
|
|
4
|
81.3
|
9.5
|
|
2
|
23.6
|
2.8
|
|
4
|
72.4
|
8.7
|
|
2
|
57.6
|
6.7
|
|
4
|
88.4
|
10.6
|
|
2
|
44.6
|
5.2
|
|
4
|
23.2
|
3.3
|
1. Write the equation of the model based on the above data. Interpret the coefficients of the model in the context of the problem.
2. If the traffic flow in front of all stores is the same, 80,000 cars, predict sales for city 1 and city 4, based on the fitted model. Which of the four city stores have the least expected sales?
3. Use the prediction equation to graph (by hand or Excel) the response lines that relate predicted weekly sales, , to traffic flow, , for each of the cities.
4. Write a model that includes interaction between city and traffic flow.
5. Fit the model of part 4 to the data.
6. Graph the interaction model.
Multiple Choice Questions:
1. The error term in simple regression represents:
a. the difference between the estimated regression line and the population line.
b. the vertical distance from any point to the mean value of Y's.
c. the vertical distance from any point to the population regression line.
d. the vertical distance from any point to the estimated regression line.
e. none of the above.
2. In a multiple regression problem involving two quantitative independent variables, if β1 is computed to be -2, it means that
a. the relationship between x1 and y is significant.
b. y decreases by 2 units for each increase of one unit of x1, holding x2 constant.
c. the value of y is -2 when x1 equals zero.
d. none of the above.
3. The coefficient of multiple determination
a. measures the variation around the predicted regression equation.
b. measures the proportion of the variation in y that is explained by all the independent variables in the model.
c. measures the proportion of the variation in y that is explained by x1 holding x2 constant.
d. will have the same sign as β1.
4. If we want to add the independent variable, gender, to our existing model, how many variables are needed to represent its two levels,
a. 1
b. 2
c. 4
d. need more information
e. none of the above
5. The graph of a model with one qualitative independent variable with three levels is
a. three lines
b. three nonlinear functions
c. two parallel lines
d. a bar chart
e. cannot be graphed
6. The least squares method guarantees that the
a. sum of absolute deviations between each observation and the model is least compared to any other model
b. sum of the deviations between each observation and the mean is zero
c. sum of squared deviations between each observation and the model is minimum compared to any other model
d. all of the above
e. none of the above