Reference no: EM131096797
10-701 Machine Learning - Spring 2012 - Problem Set 3
Q1. Decision trees
Short decision trees with few levels are more desirable in practice because they generalize well to new data and are less prone to overfit.
1.1 Information Gain-
Most of algorithms for learning the structure of decision trees rely on a heuristic to pick an attribute to split the trees in sequential steps. In this question, we are particularly interested in discrete valued attributes. We explore a popular measure: Information Gain (IG) and relate it to other concepts in probability.
We start with these definitions. Assume we have two discrete random variables X and Y taking values {1, . . . , m} and {1, . . . , n} respectively.
-Entropy
H(X) = x=1∑m-p(X = x) log p(X = x) (1)
-Conditional entropy of Y given X: H(Y|X). Note that this is different from entropy of Y conditioned on X = x: H(Y|X = x).
H(Y|X) = x=1∑mp(X = x)H(Y|X = x) (2)
-Information Gain
Y) = H(X) - H(X|Y) (3)
-Kullback-Leibeler divergence (K-L divergence) between two distributions.
DKL(P||Q) = ∑iP(i) log P(i)/Q(i) (4)
-Mutual Information
I(X; Y) = x=1∑my=1∑np(X = x, Y = y) log (p(X = x, Y = y)/p(X = x)p(Y = y)) (5)
1. Show that IG(X; Y) = IG(Y ; X).
2. Show that IG(X; Y) = H(X) + H(Y) - H(X, Y).
|
Having a Car
|
Student
|
Owning a house
|
Risk
|
Count
|
|
Yes
|
Yes
|
Yes
|
Yes
|
5
|
|
Yes
|
Yes
|
No
|
Yes
|
3
|
|
Yes
|
No
|
Yes
|
Yes
|
15
|
|
Yes
|
No
|
No
|
Yes
|
2
|
|
No
|
Yes
|
Yes
|
Yes
|
5
|
|
No
|
Yes
|
No
|
Yes
|
0
|
|
No
|
No
|
Yes
|
Yes
|
4
|
|
No
|
No
|
No
|
Yes
|
1
|
|
Yes
|
Yes
|
Yes
|
No
|
3
|
|
Yes
|
Yes
|
No
|
No
|
3
|
|
Yes
|
No
|
Yes
|
No
|
2
|
|
Yes
|
No
|
No
|
No
|
2
|
|
No
|
Yes
|
Yes
|
No
|
2
|
|
No
|
Yes
|
No
|
No
|
10
|
|
No
|
No
|
Yes
|
No
|
3
|
|
No
|
No
|
No
|
No
|
10
|
|
Table 1: Data from Problem 1.
|
3. Write the Information Gain in terms of the K-L divergence of two distributions. In other words, find P and Q such that IG(X, Y ) = DKL(P||Q).
1.2 Tree Construction-
It is that time of the year to file tax returns to the IRS. Bob is hired by a famous tax software company to assess the risk of audit for customers. Unfortunately, being a poor grad student, he has paid no attention to taxes. He decides to build a decision tree to classify customers into high and low risk groups. The data is shown in Table 1.
1. Show the steps in constructing the decision tree (without postpruning) and the final tree using the algorithm we described in class. What is the classification error?
2. Bob would like to add two new attributes: Income and Age. Assume that the decision tree splits on an attribute X by splitting the examples into two sets: X < a and X ≥ a. How about when an attribute has K distinct values? How should we determine the best splitting value a?
3. Real datasets may not be perfect, e.g. some may contain systematic errors. In each of these situations, if there are systematic errors, describe how you detect them and what we should do.
- An attribute I has only one single value.
- Attributes T1 and T2 are duplicates. That means all examples having the same values for these two attributes.
Q2. Neural Networks
2.1 Binary classification-
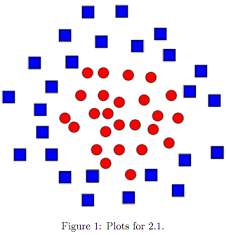
Which classifiers: kNN, logistic regression, neural networks, naive Bayes can learn the decision boundary shown in Figure 1?
2.2 Boolean functions and neural networks-
For this problem, we only consider neural networks with a hidden layer. Each unit has a weight w and uses the following activation functions:
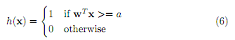
1. Hard-threshold function: for a constant a,
2. Linear: h(x) = wTx (7)
In class, we show that this type of networks can compute the boolean functions OR, AND and XOR.
1. How many boolean functions f(x1, x2), where x1, 2 ∈ {0, 1}, are there?
2. For any boolean function f(x1, x2), can we build a neural network to compute f?
If yes, please prove by construction? If no, explain in details.
2.3 Two layer neural networks-
We now consider neural networks with a hidden layer with only one input signal x and one output signal y. Using hard threshold and/or linear activation functions. Which of the following cases can be exactly represented by a neural network? For each case, if yes, draw the network with choice of activations for both levels and briefly explain how the function is represented. If no, explain why.
1. Polynomials of degree one.
2. Polynomials of degree two.
3. Hinge loss: L(x) = max(1 - x, 0).
2.4 Network Training-
We train a neural network on a set of input vectors {xn} where n = 1, . . . , N, together with a corresponding set of target K-dimensional vectors {tn}. We assume that t has a Gaussian distribution with an x-dependent mean, so that:
p(t|x, w) = N (t|y(x, w), β-1I) (8)
where β is the precision of the Gaussian noise. We would like to find the parameters w using the MLE principle:
wMLE = argmaxw n=1∏Np(tn|xn, w) (9)
1. Show that solving (9) is equivalent to minimizing the sum-of-squares error function:
E(w) = ½n=1∑N||y(xn, w) - tn||22 (10)
2. Consider a network with one hidden layer as shown in Figure 2. Assume that each hidden unit j computes a weighted sum of its inputs x of the form:
= ∑iwjixi (11)
where wj and z are the weights and input of this hidden unit; and use an activation function h(aj ) = zj. Also the output unit k computes a weighed sum of its inputs z of the form
bk = ∑jw'kj zj (12)
where w'k are the weights of this output unit. This unit outputs yk = bk. Together, the output of this network is:
y(xn, w) = [y1, y2, . . . yK]T (13)
To train a neural network, we need to compute the derivatives of E(w). We can do so by considering a simpler quantity En = ½||y(xn, w) - tn||22. Show that
∂En/∂wji = (h'(aj)∑kw'kj δk)xi (14)
where w'k are weights of the output units and δk = yk -tk. Hints: This is covered in section 5.3.1 of PRML. You should try to follow the derivation there.
Q3. SVM
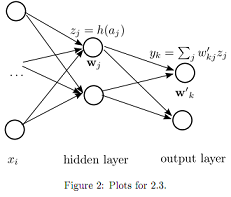
In this problem, we consider training a SVM on a set of inputs {xn} where n = 1, . . . , N, together with a corresponding set of target values {tn} (tn ∈ {-1, 1}). The goal is to maximize the margin and at the same time allows some small misclassifications. An example is classify as follows:
where C ≥ 0 is a parameter that controls the trade-off between the stack variable penalty and the margin.
3.1 Slackness and Kernel-
Figure 3 shows the decision boundaries of training four SVMs using different values of C and different kernels. For each of the examples, specify which setting was used to get the result.
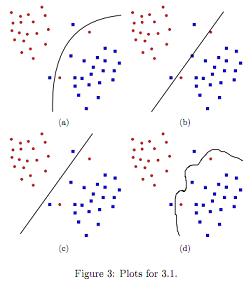
1. C = 1 and no kernel is used.
2. C = 0.1 and no kernel is used.
3. C = 0.1 and the kernel is K(xi, xj) = exp -(||xi-xj ||2/2.
4. C = 0.1 and the kernel is K(xi, xj) = xiTixj + (xiT xj)2.
3.2 Dual formalization-
1. Using the Lagrangian multipliers, show that the corresponding Lagrangian is
L(w, b, a) = ½||w||2 + Cn=1∑Nξn - n=1∑Nan{tny(xn) - 1 + ξn} - n=1∑Nµnξn
Be explicit in specifying which multiplier is correspondent to which constraint.
Hints: A brief introduction to Lagrange multipliers is in Appendix E of the PRML book.
2. The Karush-Kuhn-Tucker (KKT) conditions for the optimal solutions are:
an ≥ 0 (19)
tny(xn) - 1 + ξn ≥ 0 (20)
an{tny(xn) - 1 + ξn} = 0 (21)
µn ≥ 0 (22)
ξn ≥ 0 (23)
µnξn = 0 (24)
3. By taking the derivatives of L(w, b, a), show that the dual problem is:
maxn=1∑Nan - ½ n=1∑Nm=1∑Nanamtntmk(xn, xm) (25)
s.t. 0 ≤ an ≤ C, n = 1, . . . , N (26)
n=1∑N antn = 0 (27)
Please show all the steps in very details.
4. Given a solution to the dual problem, which inputs are support vectors?
5. Can you compute w from the dual solutions? If yes, give the formula, if no, explain why? Hints: Do we always have φ(xn)?
6. How can we classify a new example x'?
3.3 Implementation-
1. Implement SVM in MATLAB.
function [y_new, test_error, training_error] = train_svm(x, t, x_new, C)
This function trains a SVM with inputs x, t, C and classifies new examples x_new and outputs the predictions in y_new.
Your implementation should satisfy these requirements:
- You cannot use any existing implementations of SVM including MATLAB's built-in functions. However, you can use a quadratic programming(QP) solver (e.g. MATLAB's quadprog).
- You should use a subroutine to compute the Kernel distance between two input examples so that it is easy to use different kernels with your implementation.
2. A dangerous mutant of bird flu viruses was discovered and a widespread pandemic is imminent. A vaccine was developed for improving immunity against this potent virus. However, this new vaccine is very expensive and only effective for a subset of patients. Expression of two genes X, Y are shown as predictors of the vaccine's effectiveness. You are asked to train a SVM to predict the vaccine's effectiveness on patients using gene expression measurement. Download the dataset from the course website. The .mat file contains two matrices: train and test. There are 160 training examples and 40 testing examples.
(a) Using no kernel (or φ(xn) = xn)), train a SVM using different values of C = 0, 0.1, 0.3, 0.5, 1, 2, 5, 8, 10. Use 4-fold cross validation and report the train and test errors. Produce a plot of 2 curves: training and testing error. The x-axis shows different values of C and the y-axis shows the error rate.
Which value of C yields the best training and testing error rate?
Which value of C should you use?
Finally, plot the training and testing examples along with the decision boundary. What do you observe?
Hints: To plot the decision boundary, you can use the code in svmplot.m.
(b) Now use Gaussian kernels K(xi, xj) = exp{-(||xi-xj ||2/2)} and repeat the previous experiment.
(c) Summarize the result of two experiments. Should we use Gaussian kernels at all?
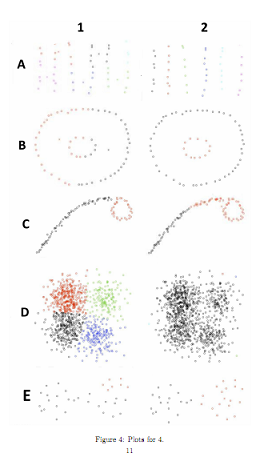
Q4. Hierarchical clustering v.s. K-means
Single linkage and K-means can give very different clustering results and one may be more preferred than the others. In each of the examples in Figure 4, write down whether the clusters are produced by K-means (KM) or agglomerative clustering with single linkage (SL).
Attachment:- Data.rar