Reference no: EM132189223
Assignment -
The pdf document should include any numerical results and plots and textual responses and include all the R-code necessary to achieve the correct answer for each part. The R code sections should be in a uniform width font such as Courier.
1. Write R code to create the barplot below of the expression levels of the "Ras-Like Protein Tc4" gene from the golub dataset. Hint: the gene names are listed in golub.gnames.
biocLite(c("hopach"))
library(hopach)
data(golub)
View(golub)
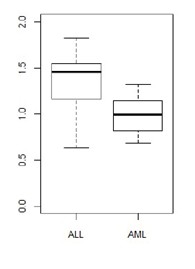
Test the hypothesis that the expression levels of this gene differ between ALL and AML patients at a significance level α = 0.05. Explain all of the steps in your testing procedure, i.e. what is your null hypothesis, why did you choose that particular test, what is your conclusion and why.
2. Set up a for-loop that allows you to take 1000 random samples of size k = 20 from a normal distribution of 'true' mean=10 and standard deviation =5. In the loop, calculate the mean for each sample, and store the sample mean values in a vector sample_mean.
Plot the sample mean values for sample size k = 20 on a plot. Indicate the true mean. (Hint: you can use the function abline to plot a straight line at the true mean value.)
Now create a function that calculates the standard deviation of sample_mean. Put everything in a function that returns the standard deviation of 1000 means for user-specifiable sample size k, true mean m and standard deviation s.
sd_sample_mean<-function(k,m,s){...}
Using this function calculate the standard deviation of the sample mean for k =3 and k=100. Have a look at the lecture notes: what should be the theoretical standard deviation of the mean of samples of size 3 and 100 taken from this distribution?
Plot the standard deviation of the sample mean from your function for random samples of size from 3 to 100. Add a line showing the theoretical expectation for the standard error of the mean
3. Mass spectrometry measurements of the proteome that quantitate the amount of each protein present are known to be NOT normally distributed about the true quantity of protein present. A series of experiments is carried out on wild-type and knockout mutant cell lines. A transcription factor has been deleted in the knockout cell line. For each of the cell lines, 20 replicate measurements of the concentration of a protein X are carried out by mass spectrometry.
wildtype<-c(560,968,3297,1200,858,646,992,2507,2037,546,2929,1171,1389,1958,3149,1165,2257,2120,65,1571)
knockout<-c(589,232,983,2597,827,1363,634,12,643,1889,2840,1291,939,811,3290,525,90,543,2400,3012)
The researchers wish to report the results of these experiments and to determine if the measurements support the idea that deletion of the transcription factor changes the median concentration of protein X present in the cell. Why is it better to report the results of these experiments in terms of the median value of the measurements rather than the mean? Calculate a 95% confidence interval for the median protein X concentration of each cell line. Use a bootstrap approach to test if the medians of the two cell lines differ.
4. It is suspected that mutations in gene X are involved in the response of cancer patients to a drug treatment. Of 236 patients diagnosed with a particular form of cancer, it is found that 82 have a mutation in gene X and the remainder have the normal version of the gene. All of the patients take the drug for one year, of these 87 die within one year and the rest survive. Of the survivors, 42 have a mutation in gene X.
(a) Organize the data into a contingency table and formulate a null hypothesis to test for the dependence of survival on mutation of gene X.
(b) Perform an appropriate test to determine whether the null can be rejected
(c) Compute an appropriate measure of the strength of the effect of mutation in gene X on response to the drug
5. The following data describes the levels of a cellular enzyme and a metabolite in a set 20 experiments
enzyme <- c(0.114, 0.510, 0.722, 1.276, 1.928, 2.150, 2.238, 2.732, 2.758 , 3.015, 3.616, 3.951, 4.281, 5.315, 6.693, 6.964, 7.056, 8.162, 8.216, 8.410)
metabolite <- c(56.1, 60.6, 67.2, 72.7, 80.5, 83.2, 82.2, 88.9, 89.5, 90.6, 94.9, 95.2, 97.1, 96.3, 77.6, 71.6, 69.3, 37.2, 36.0, 26.9)
Show, with appropriate statistical test(s), that the level of the metabolite is dependent on the level of the enzyme.
Find the best-fit polynomial equation that describes this dependence.
Attachment:- Assignment File.rar