Reference no: EM13518767
1. For an EconS 499 project, a former SES student (Scott Moore) collected data for all NFL teams for the time period 2000-2009. This resulted in 310 observations. He was interested in identifying the factors that explain ticket prices for NFL football games. He decided to start with a simple model, regressing ticket prices on attendance:
Ticketpricei= B1 + B2 Attendancei + ui
Data for attendance (measured as season total attendance in 100,000 people) and ticketprice (in $) and several other variables for the 310 observations are in the file ScottNFL_Fall2014.xls in the folder on Angel with this assignment. This problem Problem 1 and 2 focuses only on teams in the NFC conference. The variable Conference, included in the dataset, indicates which conference the team is in. (This is not the Conference Playoffs variable!)
Assume that the basic assumptions of the classical liner regression model (CLRM) are satisfied. You can use either STATA (preferred) or EXCEL (as long as you can generate the graphs that you need for the assignment).
a. Obtain the OLS estimates for this model, using only teams in the NFC Conference (n=160). Using the results from your printout, write down the estimated regression line. Include the estimated slope and intercept coefficients, their estimated standard errors, the estimated standard error of the regression, and the R2 and adjusted R2 values. Make sure that it is clear which concept the numbers that you present are referring to.
b. Give an interpretation of the estimated equation in terms of the situation (and the numbers) in this problem. Does the (sign) of the estimated slope coefficient make economic sense to you?
c. Plot the data and the estimated/fitted regression line. How well does the estimated line visually appear to fit the data? On the basis of the appropriate goodness of fit measures, how well does the model fit?
d. Test the hypothesis (at the .05 level) that there is a positive relationship between Ticketprice and Attendance in the NFC Conference. Write down (using appropriate notation) the hypotheses that you are testing and show the steps of your test. Don't just circle information on your printout and don't just state your conclusion.
e. The own-price flexibility is a measure of the percentage change in ticket price (P) in response to a one percent change in attendance (Q), other things held constant. (i.e.,
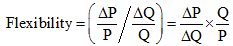
For a linear function, the elasticity varies as the ratio Q/P changes. To compute a flexibility at any point on a linear function, the relevant values of the independent variable(s) are inserted into the estimated regression equation and the corresponding value of the dependent variable is computed or forecasted. Then, the selected level of Q and the computed or predicted value of P are used in the Q/P ratio along with the estimated slope, ΔP/ΔQ, to obtain the flexibility.
For this problem, calculate the flexibility of Ticketprice (P) in the NFC in response to a one percent change in Attendance (Q), evaluated at each of these three Attendances (Q):
1) the average (sample) Attendance in the NFC, Q';
2) the lowest Attendance observed in the NFC, (Q = 2.885);
3) the highest Attendance observed in the NFC, (Q = 7.181).
Compare the magnitude and briefly discuss the three flexibility estimates.
2. After you finish the previous problem and reflect on the magnitude of the R2, you realize that you need to try some more model specifications. Again you will focus only on teams in the NFC Conference. For this problem, you decide to regress Ticketprice on Attendance (in 100,000), plus 4 additional variables - Income (per capita for the state, measured in $1000), Population (in 100,000), Salary (Median Salary of team, in $10,000), and Conference Playoffs (number). The information for these variables is in the same file as you used in 1. Assume that the basic assumptions of the CLRM are satisfied.
a. Obtain the OLS estimates for this model, again using the 160 observations in the NFC Conference. Using the results from your printout, write down the estimated regression line. Include the estimated slope and intercept coefficients, their estimated standard errors, the estimated standard error of the regression, and the R2 and adjusted R2 values. Make sure that it is clear which concept the numbers that you present are referring to.
b. Use the F test to test the overall significance of your model. Write out the null and alternative hypothesis that you're testing, report the F statistic, the p-value associated with the F statistic, and write out the conclusion of your test.
c. On the basis of the appropriate goodness of fit measures, how well does the model fit?
d. Now compare the results from the model estimated in question 1 and the model estimated in the current problem. Compare the overall fit of the models, the consistency of the signs of the estimated slope coefficients with prior expectations, the statistical significance of the estimated slope coefficients, etc. Which one would you prefer to use and why? Note that there is not a single answer to this problem!
3. Now you wonder if you can estimate your model for the two conferences in the NFL combined - the AFC and the NFC. That is, can you "pool" the data across conferences and estimate a single model for the two conferences combined, or do you need to estimate a model for each conference separately?.
- First using the same model specification as in 2 for the NFC teams, obtain the OLS estimates for the AFC teams (n=150). Using the results from your printout, write down the estimated regression line for each conference separately (you already presented the NFC results above, but repeat the results here for comparison purposes). Include the estimated slope and intercept coefficients, their estimated standard errors, the estimated standard error of the regression, and the R2 and adjusted R2 values. Make sure that it is clear which concept the numbers that you present are referring to.
- Compare the results from the two conferences. Specifically address the overall fit of the models, the consistency of the signs of the estimated slope coefficients with prior expectations, the statistical significance of the estimated slope coefficients, etc.
- Using the same model specification as in 2, obtain the OLS estimates using the entire dataset (teams from both the AFC and NFC conferences) (n=310). Using the results from your printout, write down the estimated regression line. Include the estimated slope and intercept coefficients, their estimated standard errors, the estimated standard error of the regression, and the R2 and adjusted R2 values. Make sure that it is clear which concept the numbers that you present are referring to.
- Now use a statistical test (the General Linear F test) to determine if the data can be pooled (i.e., combined over the two conferences) or used separately to estimate a model for each conference. State the null and alternative hypothesis that you are testing. You have already estimated all of the models that you need for this test.
Show the steps and results of your test, and be sure to state your conclusion correctly (i.e., should you pool the data?) You can use the following table to help guide you obtain the information from your printouts. Then use the information to calculate the test statistic needed for the test.
|
Separate Regressions
|
RSS
|
df for RSS
|
|
Group 1 (AFC)
|
|
|
|
Group 2 (NFC)
|
|
|
|
Sum
|
|
|
|
|
|
|
|
Combined (Pooled)
|
|
|
Attachment:- HW.rar