Reference no: EM13882331
Project: Noise Removal
Background
Write a MATLAB program that removes unwanted tones/noise from an audio file. You will be given an audio file, unique to you, that has unwanted tones added to it. Unique to you means that the original (clean) audio is different for each student and the added noise is different for each file. Your job is to remove the unwanted noise so you can clearly hear the message.
Approach
There at two main steps needed to remove the tones. First, determine the frequencies of the interfering tones, and second, filter out those frequencies.
Find the frequencies
The following MATLAB code will read the audio file and plot a spectrogram of it.
[xx, fs] = audioread('FileName');
xx = xx';
figure(1) specgram(xx, [], fs)
Note, FileName is the filename (with extension) of the file you were given and fs is the sampling rate of the audio file and is important information and should be saved.
The spectrogram only provides a visual guide to the location of the added noise. To determine the frequencies of the added noise, use a method discussed in class. You will most likely have to use the Matlab capability to step though an array/vector, so you can pinpoint the added noise. You may want to preprocess your audio file with one of the techniques discussed in class, but if you do be prepared to justify why you did and how the preprocessing helped in your analysis. You will want to play the audio file through your computer speakers to hear it with the noise and then with the noise removed. You are on your own to find and code the appropriate Matlab functions to do this.
Filter out the noise
Once the noise has been estimated. A filter to remove it must be created. Note that the noise may be comprised of multiple components that all must be removed.
Therefore, you may have multiple filters that will work together to filter out all the noise. Remove each individual noise component and then calculate the final composite filter.
For each individual filter, find the frequency response H (ejω^) and plot it. Be sure to describe the characteristics of the filters. Once you have the individual filters to remove each noise component, calculate the composite filter to remove all the noise components, find the frequency response H (ejω^) of the composite filter and plot it. Again, be sure to describe the characteristics of this composite filter.
Be sure to include screen captures of the frequency response of the individual filters and a screen capture of the frequency response of the final composite filter.
What to hand in:
1. A short memo describing what you did. Your memo should include:
a. An introduction (what you are doing)
b. A brief summary (what you did)
c. A table listing the frequency in Hz, the digital frequency, and any other notes about the individual filters (type, characteristics, etc.) that you created to remove the noise components
d. The frequency responses (screen captures) of the individual filters.
e. The process to find the composite filter.
f. The frequency response (screen capture) of the final filter.
g. A spectrogram (screen capture) of the clean audio signal (noise removed) in your memo. (A comparison between the original noisy audio and the cleaned audio might be nice.)
h. Highlight any extra processing you may have done.
i. Highlight any extra analysis you may have done.
j. Finally, transcribe, as best you can, the clean audio (meaning write down the words you hear in the clean audio)
k. A brief conclusion. (A sentence or two should be plenty.)
l. Remember to use a memo format.
Power Systems Engineering
Figure 1 shows a single-line diagram of a five-bus power system. Input data are given in Tables 1, 2, and 3. As shown in Table 1, bus 1 is the swing bus, to which a generator is connected. Bus 3 is a voltage-controlled bus, to which a generator and a load are connected. Buses 2, 4, and 5 are load buses.
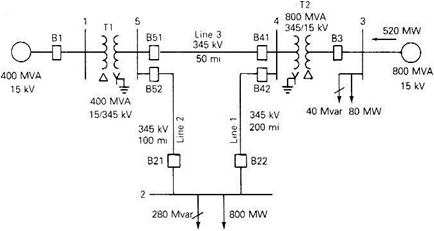
Figure 1: Single line diagram of a five bus system
Table 1
|
Bus
|
Type
|
V
per
unit
|
δ
degrees
|
PG
per
unit
|
QG
per
unit
|
PL
per
unit
|
QL
per
unit
|
OGrnax
per
unit
|
QGrnin
per
unit
|
|
1
|
Swing
|
1.0
|
0
|
|
|
0
|
0
|
-
|
|
|
2
|
Load
|
-
|
-
|
0
|
0
|
8.0
|
2.8
|
-
|
-
|
|
3
|
Constant voltage
|
1.05
|
-
|
5.2
|
-
|
0.8
|
0.4
|
4.0
|
-2.8
|
|
4
|
Load
|
-
|
-
|
0
|
0
|
0
|
0
|
-
|
-
|
|
5
|
Load
|
|
|
0
|
0
|
0
|
0
|
-
|
|
*Sbase = 100 MVA, Vbase = 15 kV at buses 1, 3, and 345 kV at buses 2, 4, 5
Table 2
| Bus |
R |
X |
Gc |
Bm |
Maximum |
Maximum |
|
|
per |
per |
MVA |
TAP |
| per |
per |
unit |
unit |
Per unit |
Setting |
| unit |
unit |
|
|
|
per unit |
| 1-5 |
0.0015 |
0.02 |
0 |
0 |
6 |
|
| 3-4 |
0.00075 |
0.01 |
0 |
0 |
10 |
|
Table 3
| Bus-to-Bus |
R' |
X' |
G'c |
B'm |
Maximum |
|
|
per |
per |
MVA |
| per |
per |
unit |
unit |
Per unit |
| unit |
unit |
|
|
|
| 2-4 |
0.009 |
0.1 |
0 |
1.72 |
12 |
| 2-5 |
0.0045 |
0.05 |
0 |
0.88 |
12 |
| 4-5 |
0.00225 |
0.025 |
0 |
0.44 |
12 |
1. Write down the Y-bus of the system.
2. Build this power system in PowerWorld Simulator.
3. Enter the input data for the system components, given in the example. Initially set transformer taps to 1.0 and run the power flow program for the power system using the Newton-Raphson (NR) algorithm. Try to find the number of iterations to find the solution.
4. We will call the case solved with NR, the "base case." Do you find any bus voltage violations? (The normal range of bus voltage is assumed to be 0.95 -1.05 p.u.)
5. For the power system, find the VAR rating of a shunt capacitor bank at bus 2 that increases V2 to 0.95 p.u. Observe the effect of the capacitor bank on the system bus voltages, line loadings, and total I2R losses. What is the effect and why?
6. Now, take the capacitor bank off to go back to the base case. Suppose both transformers in this system are tap changing transformers whose taps can be varied from 0.85 to 1.15 in increments of 0.05. Determine the tap settings required to increase the voltage at bus 2 to 0.95 p.u., while causing as few high voltage violations as possible at other buses.
7. Install a new transformer between buses 1 and 5, in parallel with the existing transformer between the above two buses. The new transformer is identical to the existing transformer. Tap setting of the transformer is also set to the nominal value, 1.0. Observe and justify the effect of adding the new transformer on the real and reactive power and VA supplied from bus 1 to bus 5.
8. Again return to the base case. Now, add another transmission line between buses 2 and 4. The parameters of the added line are the same as those of the existing line 2-4 (line 1). Observe and justify the effect of the addition of this line on the system bus voltages, line loadings, and total I2R losses.
9. Return to the base case. Now, suppose the line between buses 2 and 5 is removed for maintenance. Run the power flow program again. Is this operating condition acceptable? i.e., are the bus voltages and line power flows within the acceptable range? Can you improve the existing conditions by adding capacitors at bus 2? Do and justify!