Reference no: EM132169948
Questions -
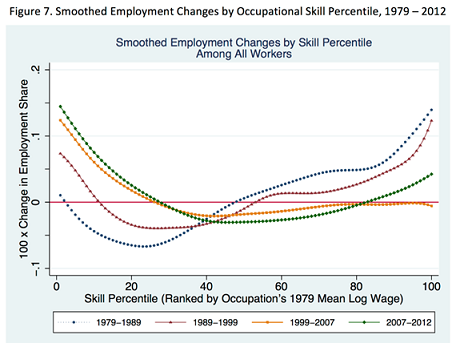
1. The following graph was created by a top economist. Use the principles of graphic design we learned to critique it, coming up with as many changes as you can.
2. Consider the following codebook entry for a variable that describes whether each respondent has private health insurance. The variable is called HIPRIV.
HIPRIV: Private health insurance
1. Mentioned
2. Not mentioned
7. Refused
8. Not ascertained
9. Don't know
Write down Stata code to create a dummy variable that indicates whether a person is privately insured. You'd like to exclude observations from your analysis if you are not sure as to their insurance status.
3. Give an example of two datasets we've analyzed or discussed, one that is a census and one that is a sample. Explain in a single sentence why each qualifies as a census or sample.
4. The CDC disseminates data on all births in the United States for researchers to analyze. For this exercise, you will need to navigate to the linked website and download Birth Data File for U.S. Territories from 2014. The filename will be Nat2014ps.zip.
That file contains a record for all births in US Territories in 2014. We will focus on US Territories since the associated datasets are smaller than the (enormous) files for the rest of the United States.
I used the following Stata commands to bring the data into Stata.
infix ///
data_year 9-12 ///
resident_status 104 ///
prenatal_number_of_visits 238-239 ///
str sex 475 ///
birthweight 504-507 ///
apgar_score 444-445 ///
birth_year 9-12 ///
birth_month 13-14 ///
mother_age 75-76 ///
mother_marital_status 120 ///
mother_education 124 ///
method_of_delivery 402 ///
using Nat2014PublicPS.c20150514.r20151007.txt
a. First consider disparities in health by maternal education. Many argue that more-educated women have healthier babies and better birth experiences. Test whether this is the case. To do so, create a single variable that divides observations by whether they are high-school dropouts, high-school graduates, or have some college experience. To keep the code simple, label teenage mothers as high-school dropouts, even though they might eventually graduate high school.
What is the mean birth weight for high-school dropouts? For high-school graduates? For those with some college experience?
b. What share of babies born in US Territories are born via cesarean section?
c. What is the c-section rate for babies born to mothers who are high-school dropouts? High-school graduates? Those with some college experience?
d. Graph the c-section rate versus mother's age for all mothers aged 16 through 45. Mother's age should be on the horizontal axis.
e. Finally, report the average age of the mother for the three education categories. These variables seem to be related: the c-section risk, maternal age, and maternal education. Describe how the relationship between education and c-section might be ''confounded'' by maternal age. Explain what that means.
Attachment:- Assignment Files.rar